Back to index
Assumptions: This draft makes some assumptions abouts its intended audience and about the content already presented in the previous part of the paper.
Audience: The audience is not assumed to have any training in Machine Learning techniques or Mathematics for that matter.
Content: The meta data are assumed to have been explained in a previous part of the paper. In particular, that we are sampling from a river, that we track location of the samples and that they broadly belong to 7 parts of the river {Upper, Mid, Lower Maranon, Tapiche, Huallaga, Ucayalli, Napo}, and that each sample comes from either black or white water.
Intentions: This part acts as a motivation for the use of machine learning methods with ecological data.
Narative: Ecosystem healthlink with fresh water ingeneral
Machine Learning on OTU count data
The OTU counts and meta data per sample provide us with an excellent opportunity to try some mainstream Machine Learning (ML) methods and evaluate their usefulness in the ecological setting. These fall under two categories; supervised and unsupervised learning. The former requires some sort of target or labels, and the aim is to establish a link between the features (OTU counts in our case) and those targets. Unsupervised is more of an exploratory approach that does not use target variables, and one of its aims is uncovering relationships and patterns between samples.
As is the case for a lot of ML experiments, the performance of the algorithms can be greatly improved by transforming the feature data. We have found that applying a cumulative-sum-scaling normalisation and subsequent log transformation improved the results for most applicationsPaulson 2013. Standard scaling (centering and scaling the features to unit variance) proved to be useful for some (linear) algorithms. In addition, the taxonomy of OTU data, where available, can be used to create subsets of the full OTU table. We have created a river set which includes only the OTUs that have been taxonomically identified and inhabit the river. In this way we can test whether just the river inhabiting OTUs have as much predictive power as the full set.
Unsupervised
The unsupervised methods presented fall under the category of clustering; samples are grouped together based on their features and how similar or not they are to each other. Each algorithm has a different way of creating groups that involves different assumptions about the structure of the data. In a true exploratory analysis setting, where meta data are absent, we would be limited in evaluating the importance of a clustering result. In our case, however, we can use information on the location and water type of samples to evaluate the ability of the algorithms to extract true patterns from the data.
Clustering algorithms require some parameters to be set by the user which, depending on how intuitive they are and what knowledge one has of their data, can be hard to do without braking the exploratory analysis framework. For example, KMeans, an algorithm that forms groups of samples by minimising the intergroup distances between samples, needs to know the number of partitions from the get go. If we did not have any other information other than the OTU counts it would be a difficult parameter to set. Here we will be presenting the most interesting results found by the algorithms, and provide all other tries in the Supplementary information.
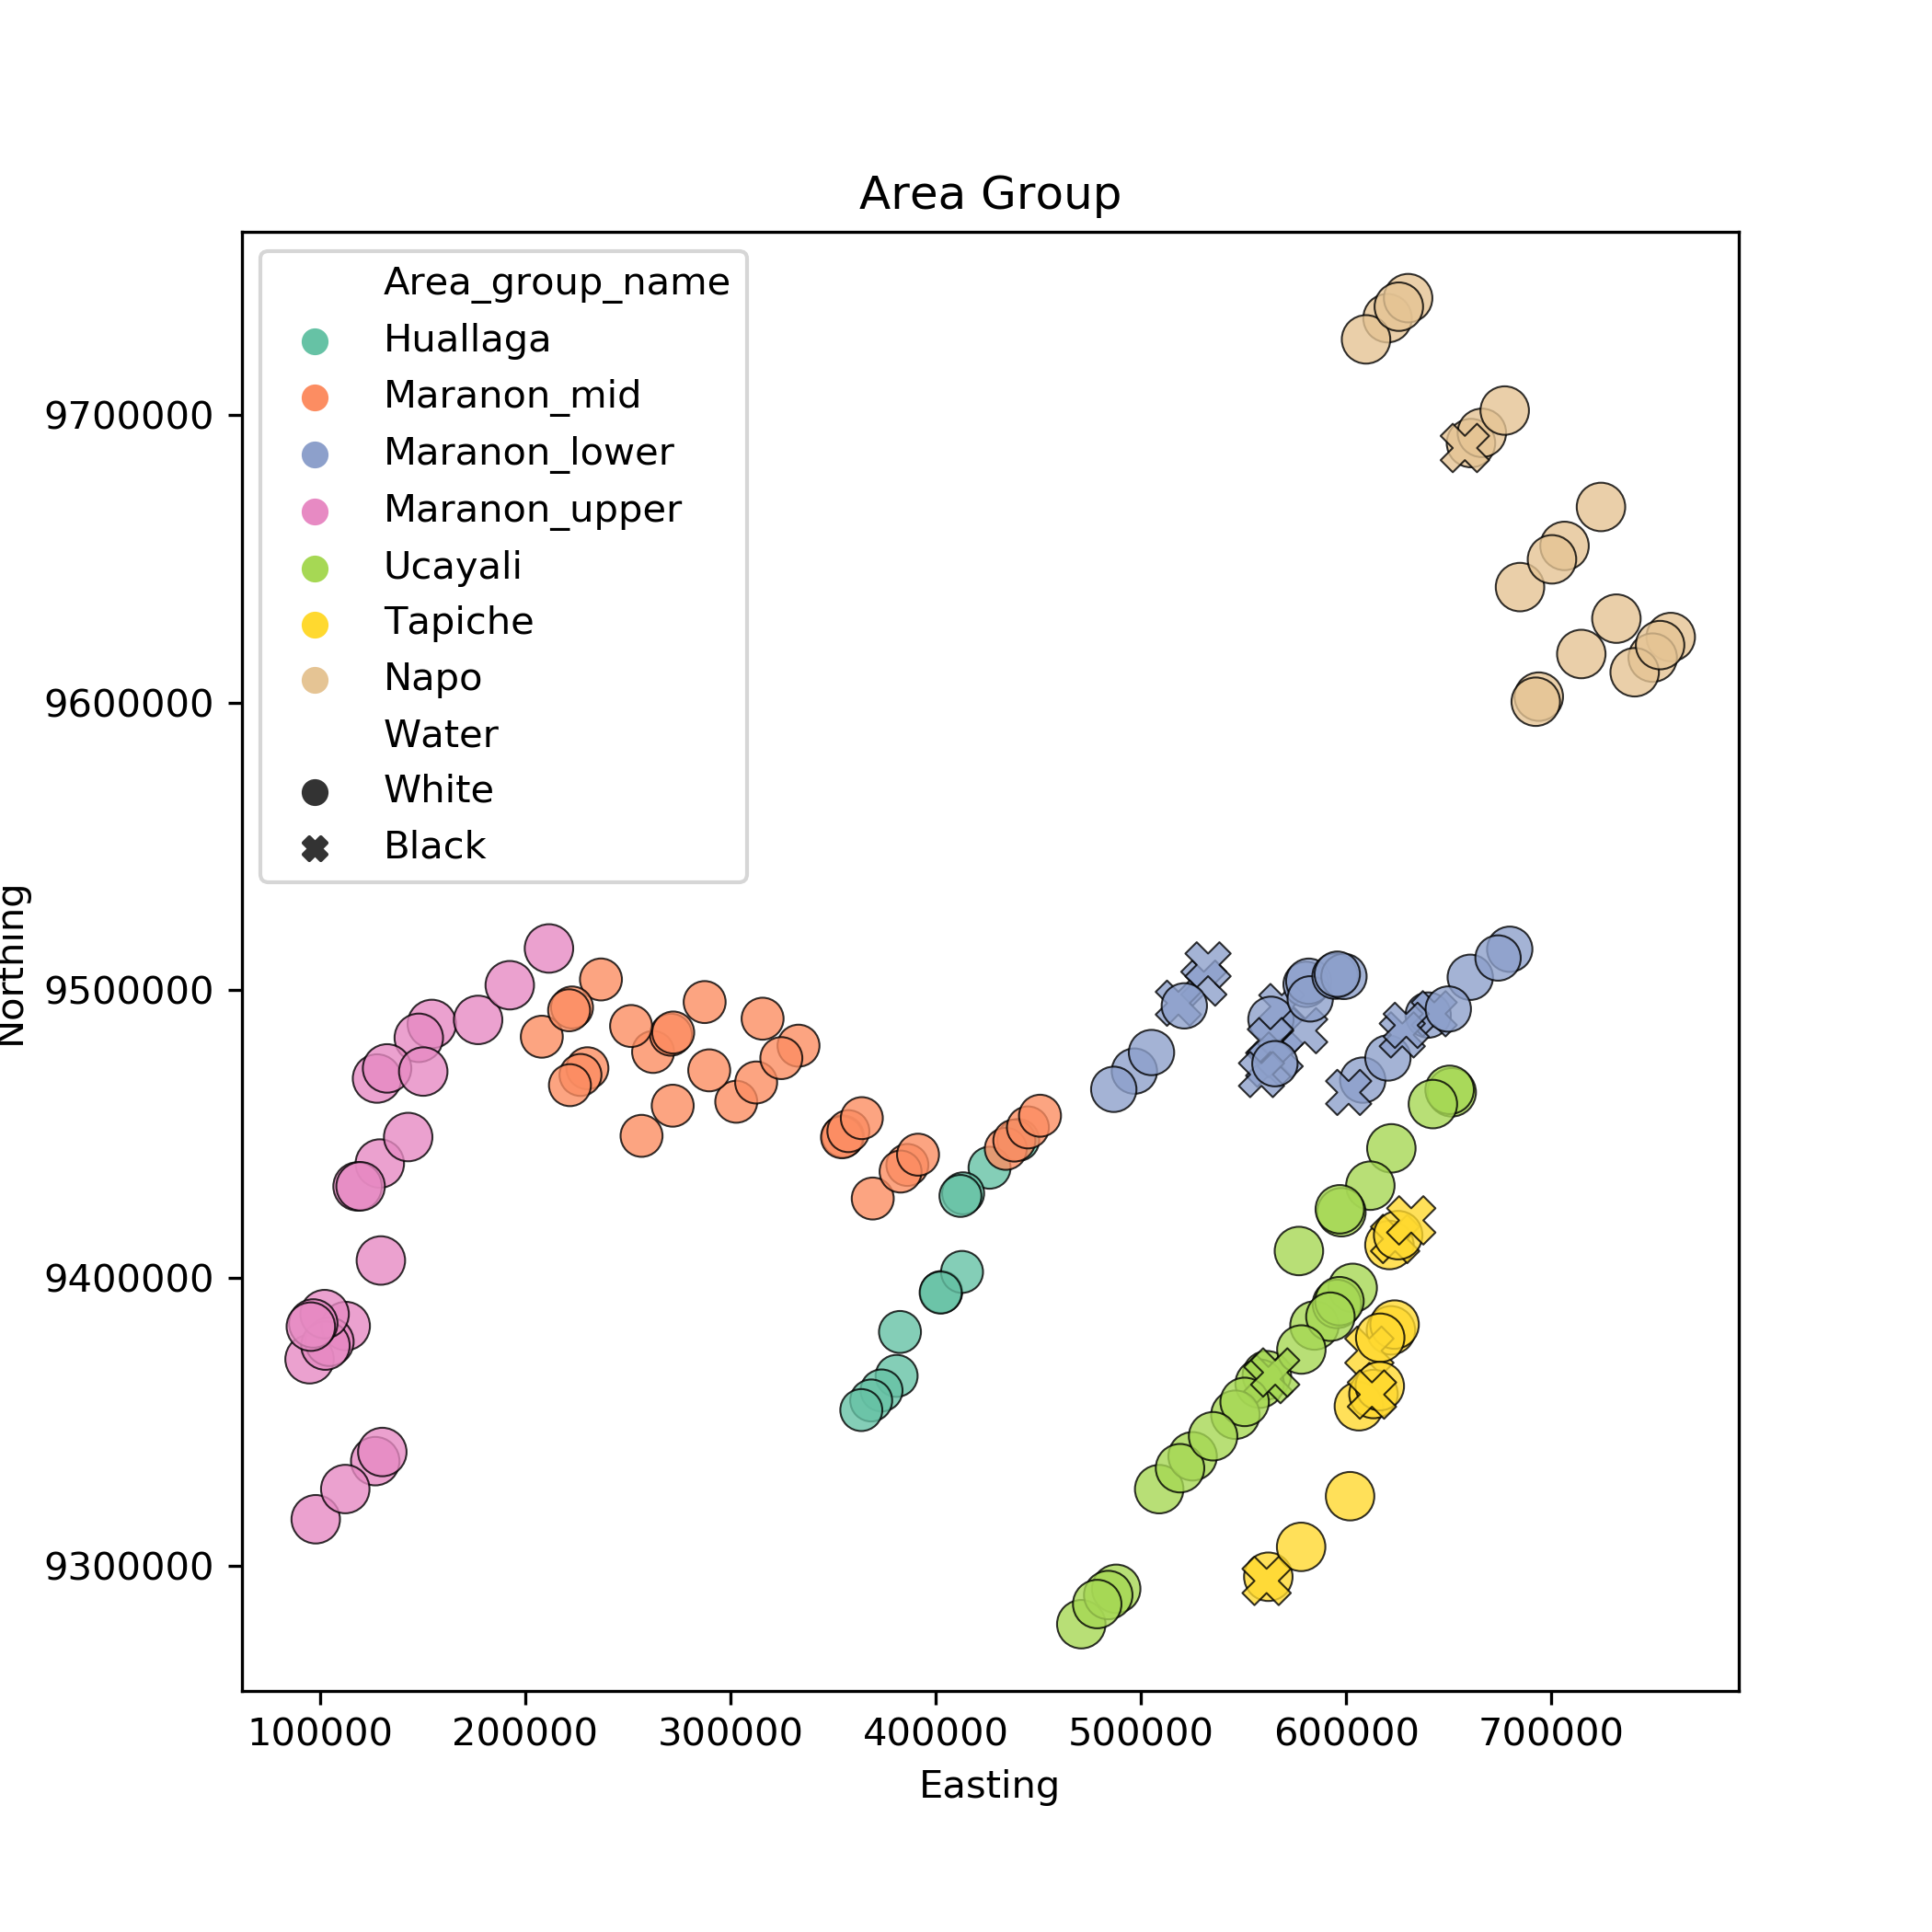
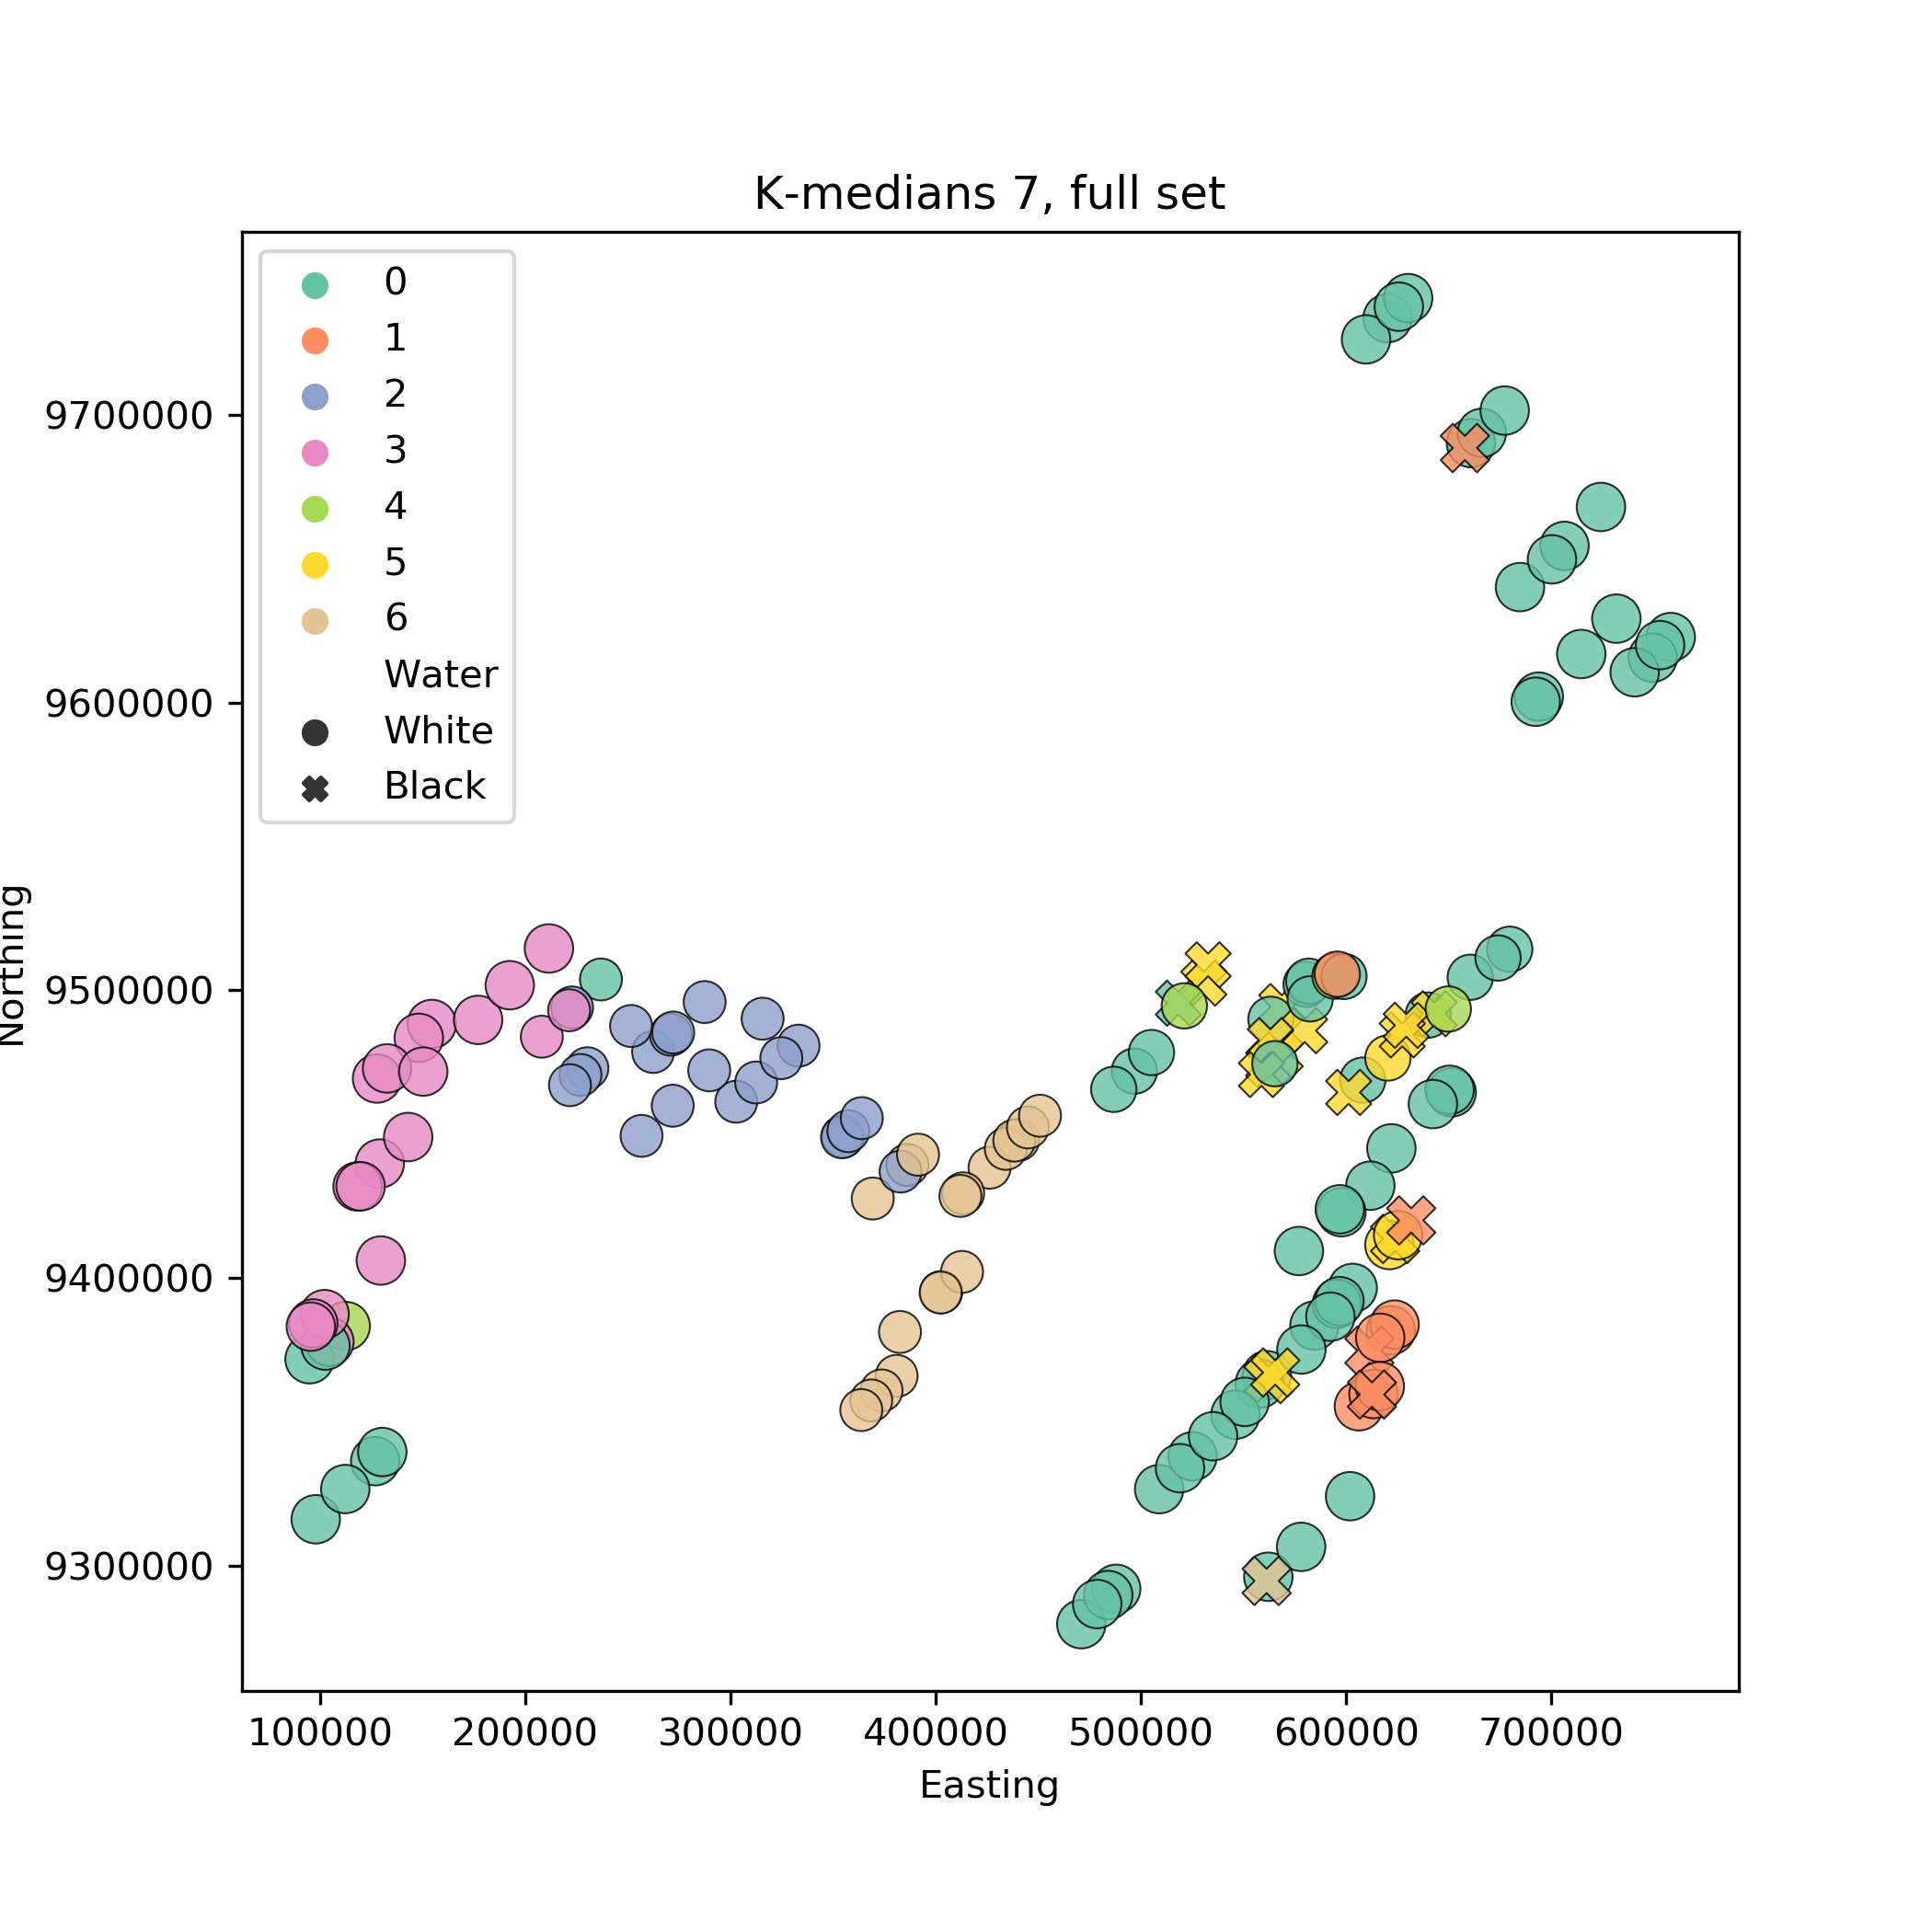
To present the results we plot each sample using its location and colour it according to the cluster the algorithm assigned it to. The different shapes of the points indicate the colour of the water. We present a plot were the colouring indicates in which area group they belong to.
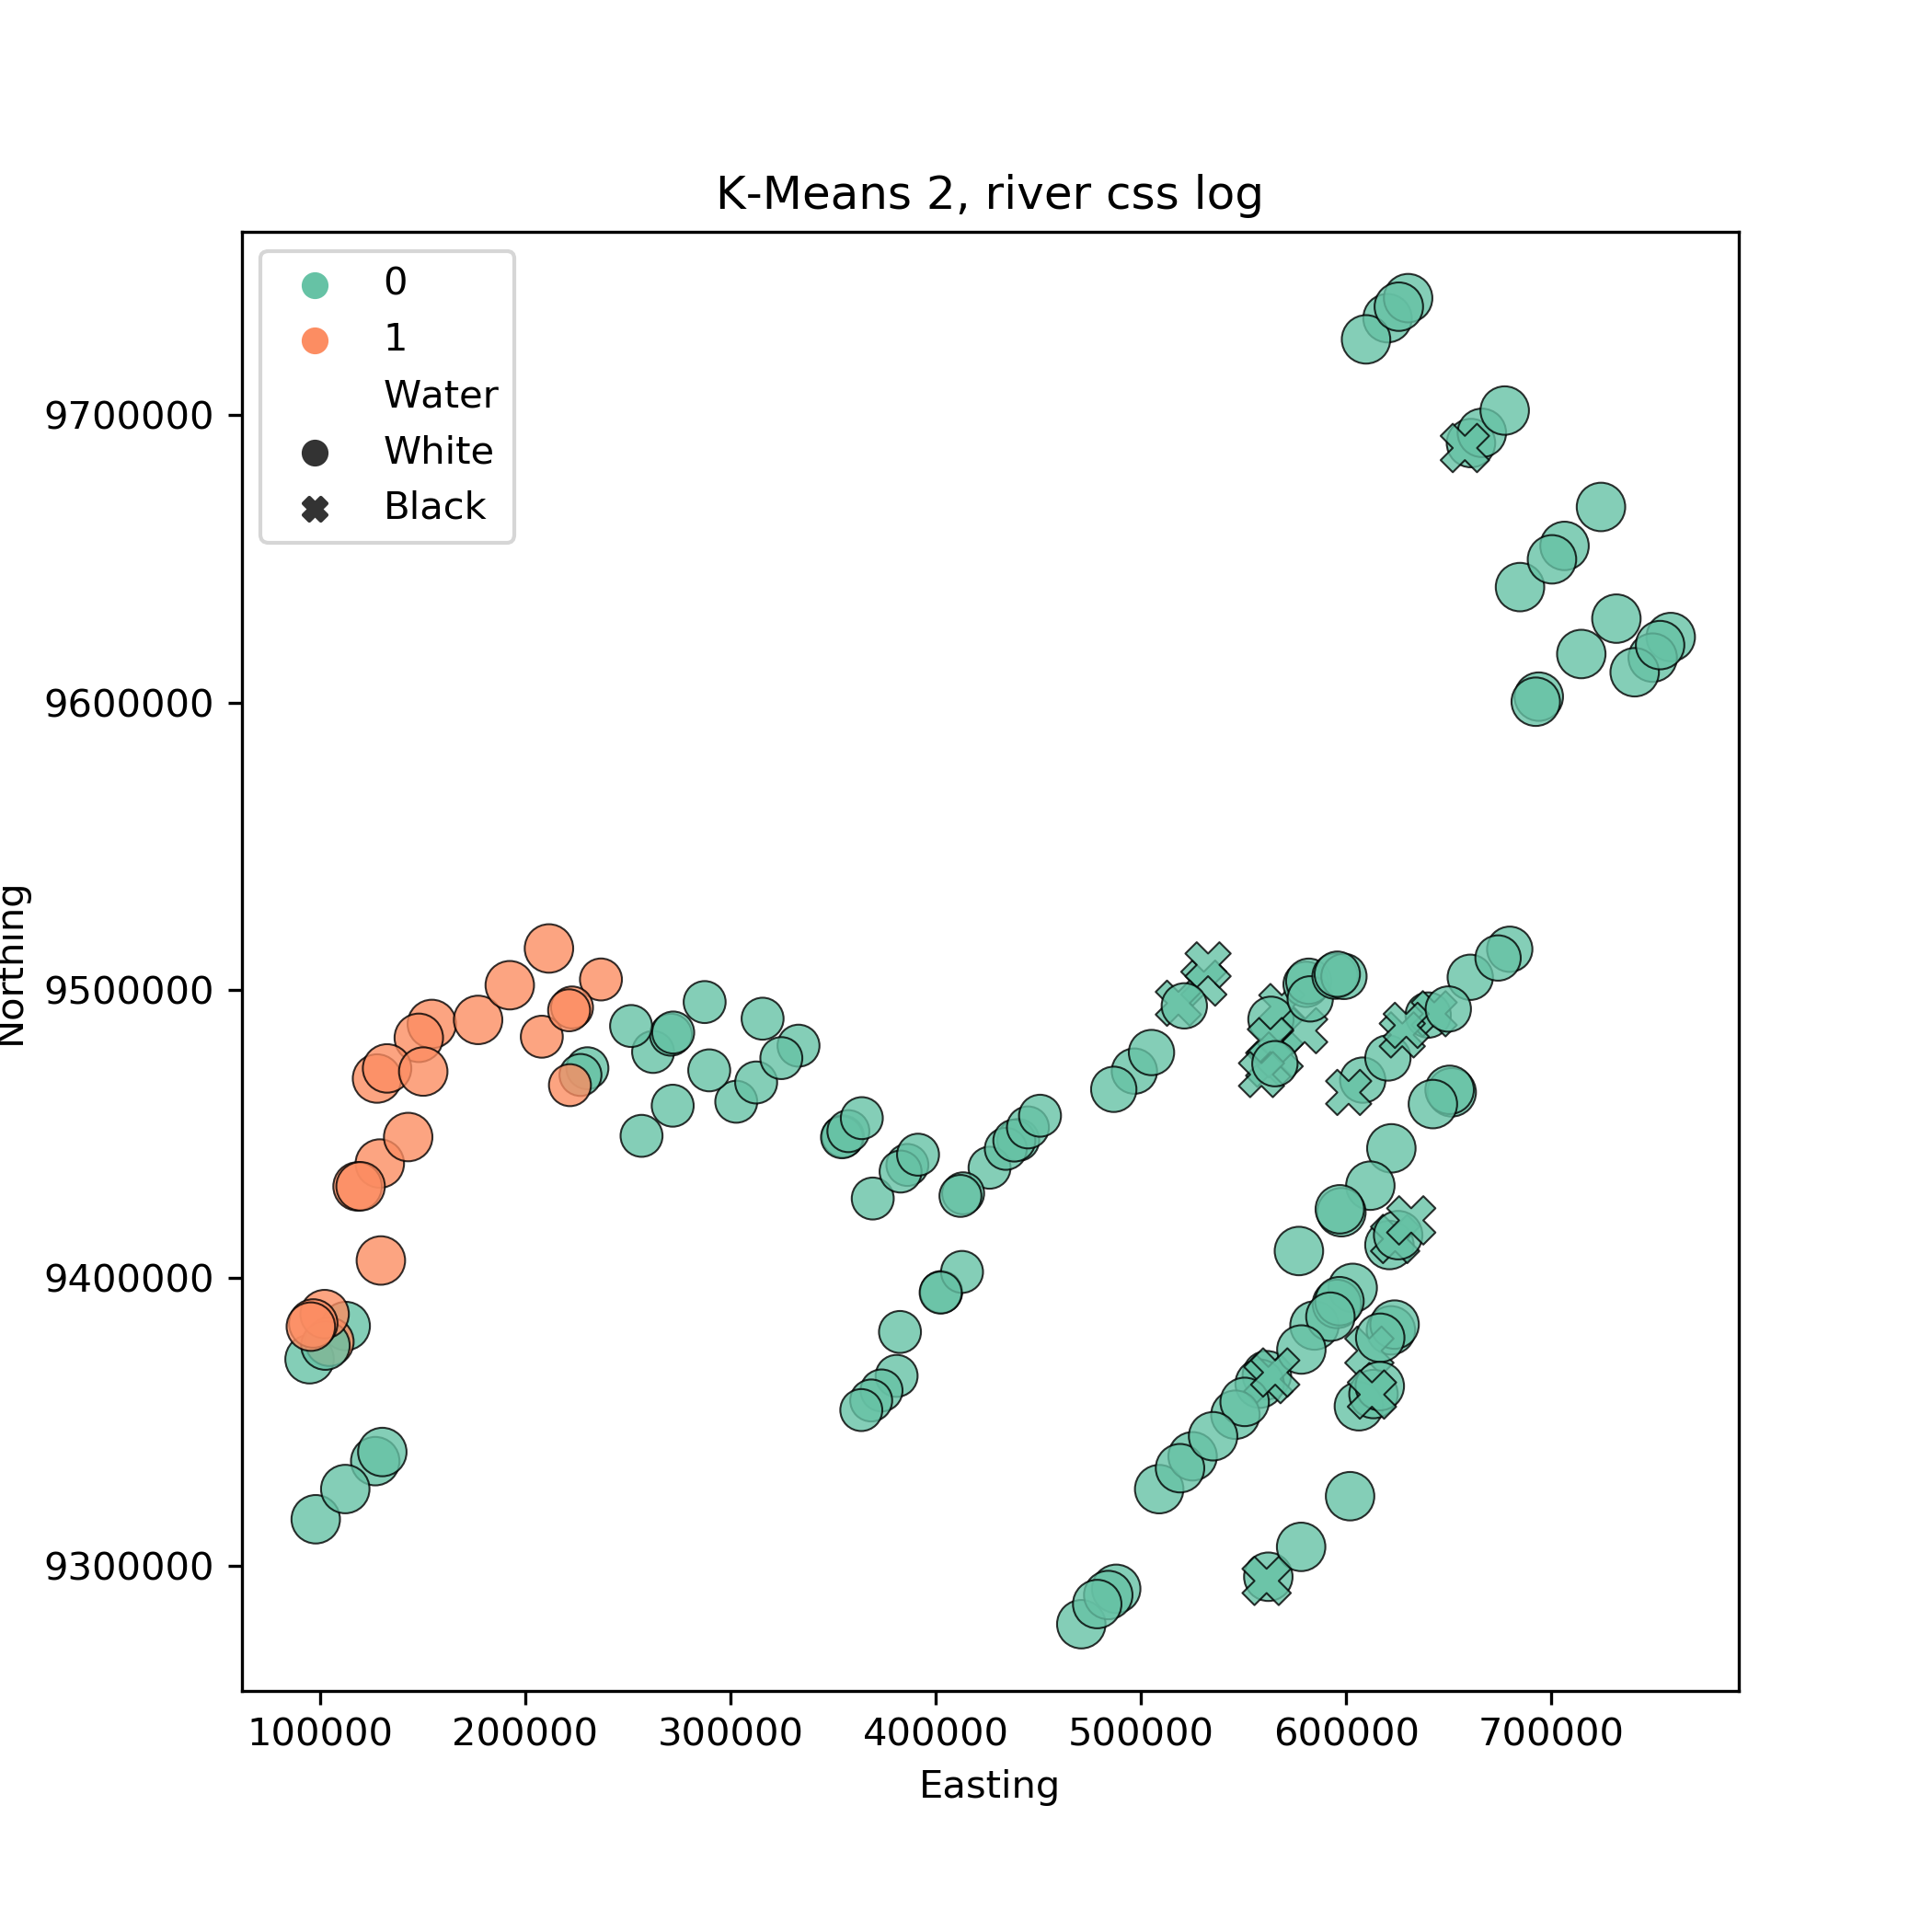
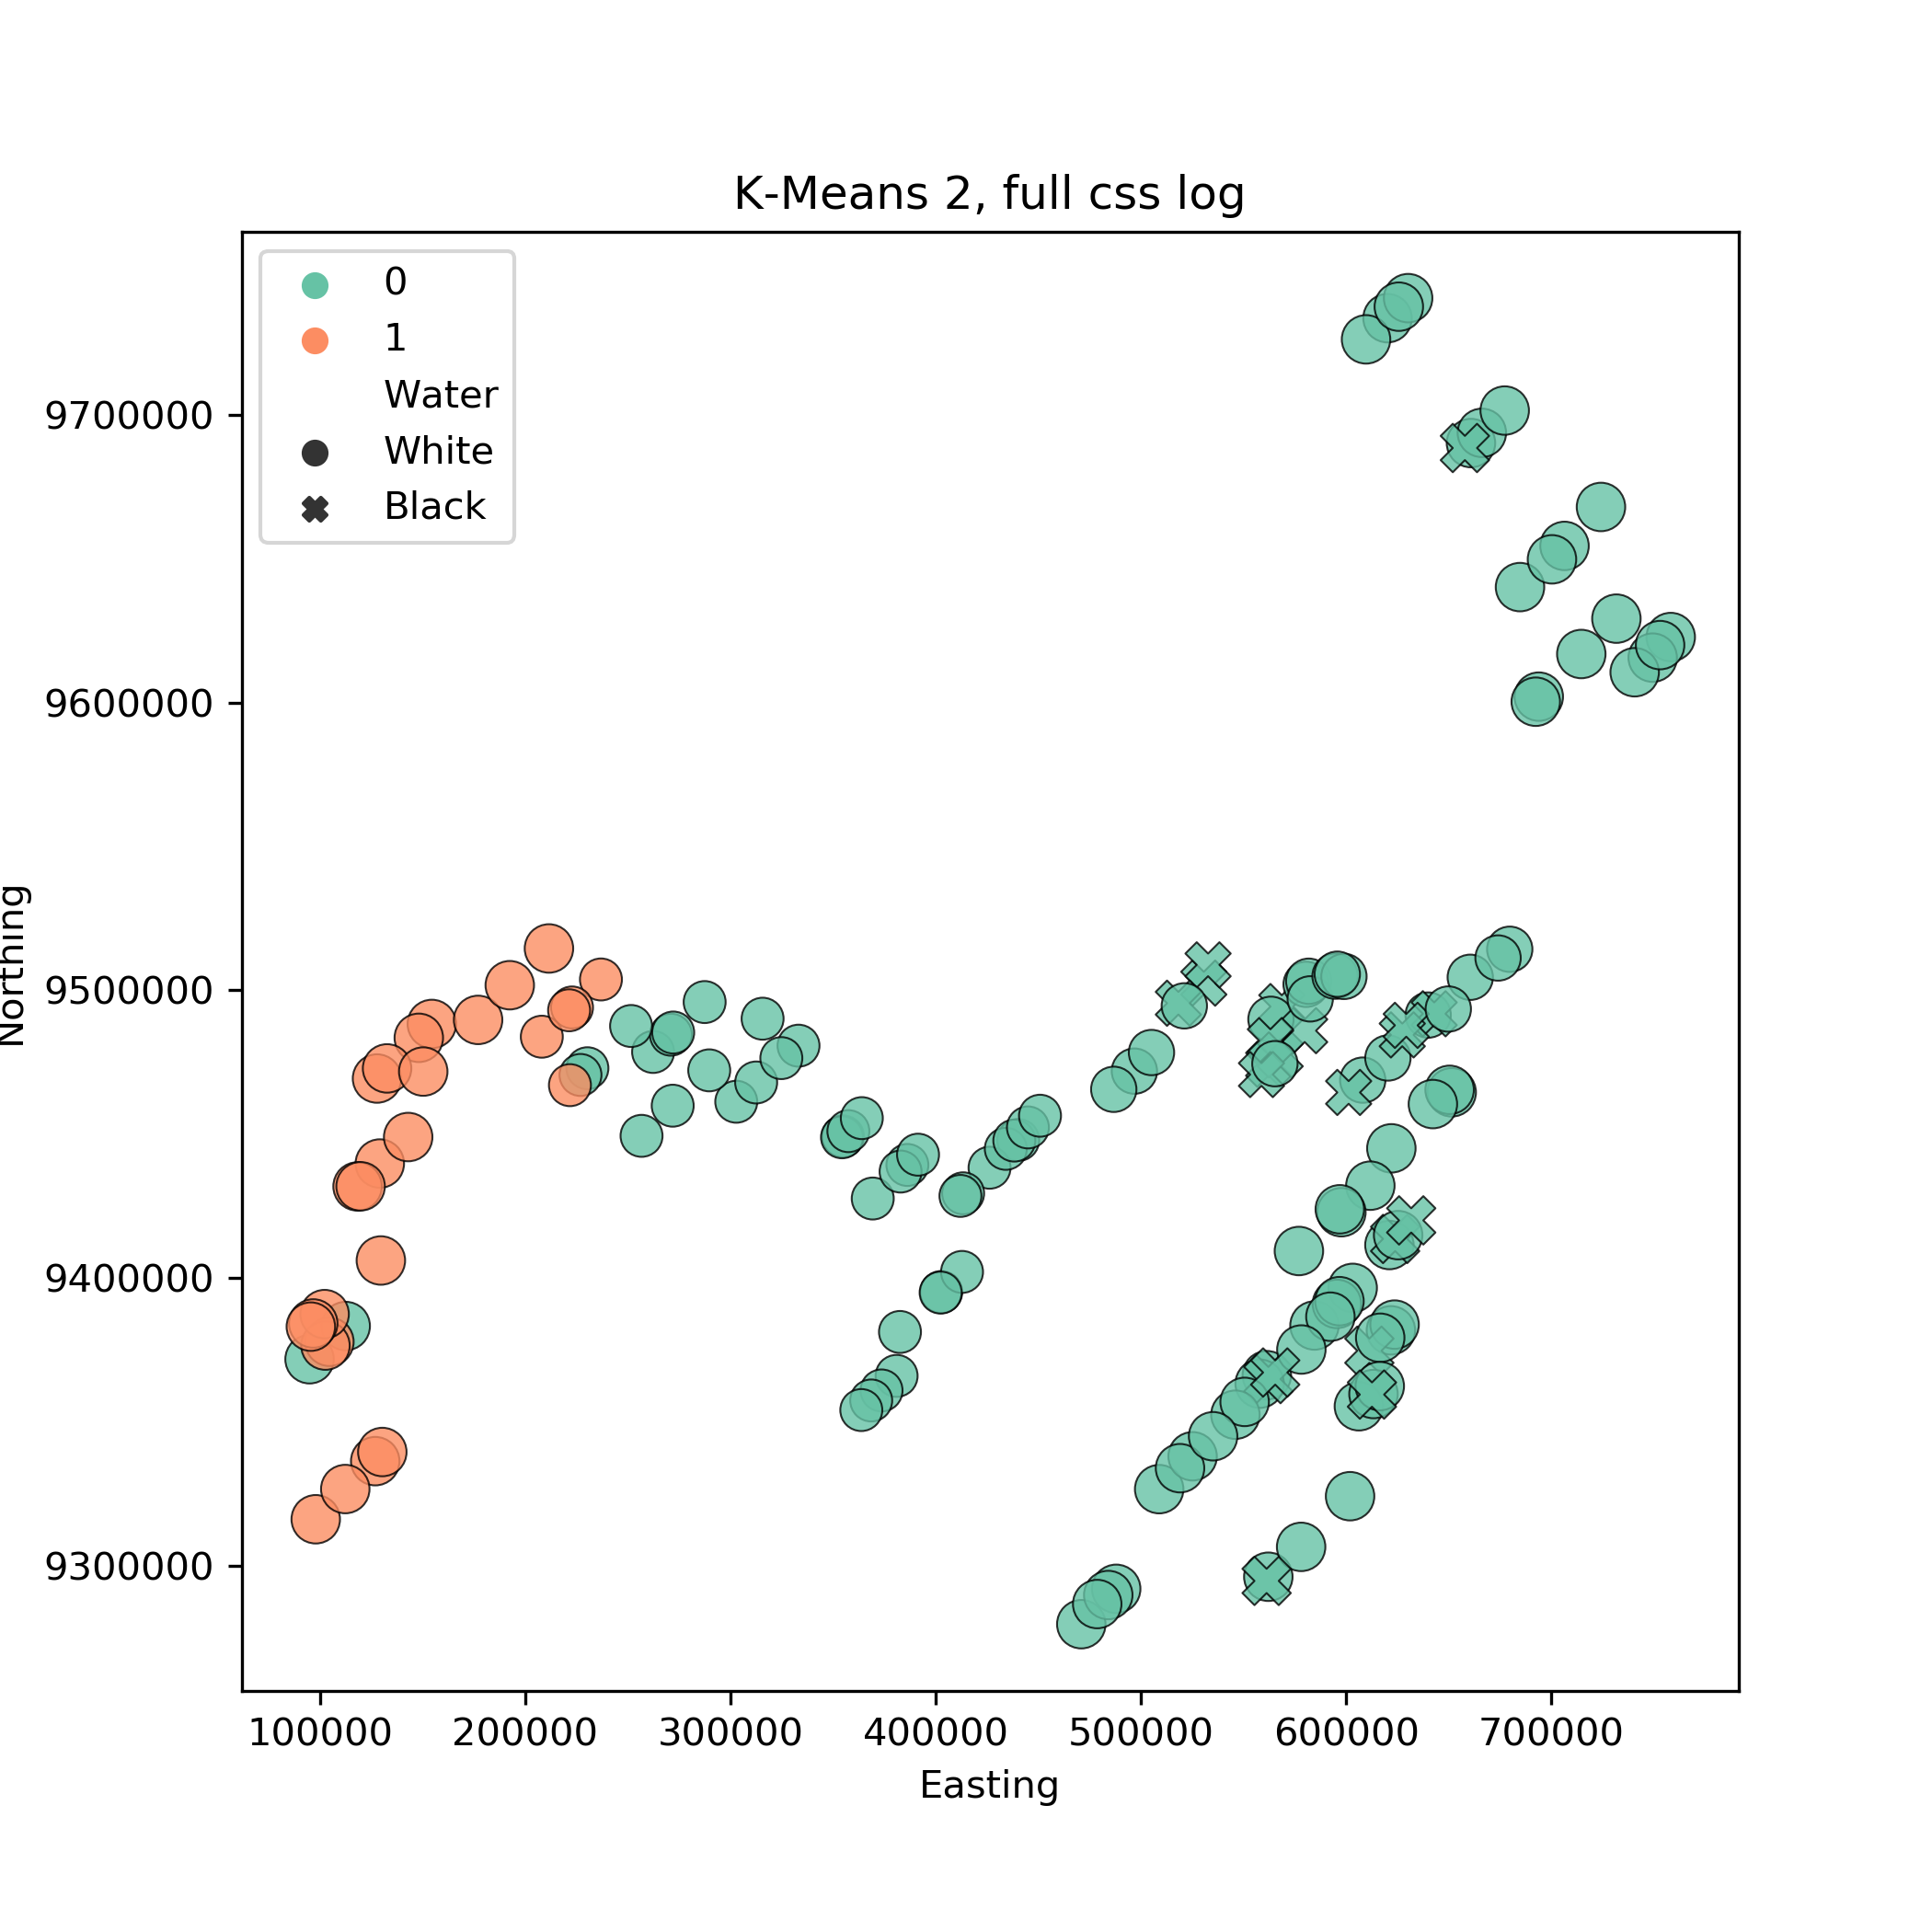
A clustering of 2 groups performed using KMeans grouped the data based on location rather than water colour. You can see in the following figure, where samples were plotted using their northing and easting coordinates, that the algorithm separated the samples before the pongo from those after it, except some on the south western part. This result was obtained using CSS normalisation and log transformation on the river set data set. The full set produces a similar partition.
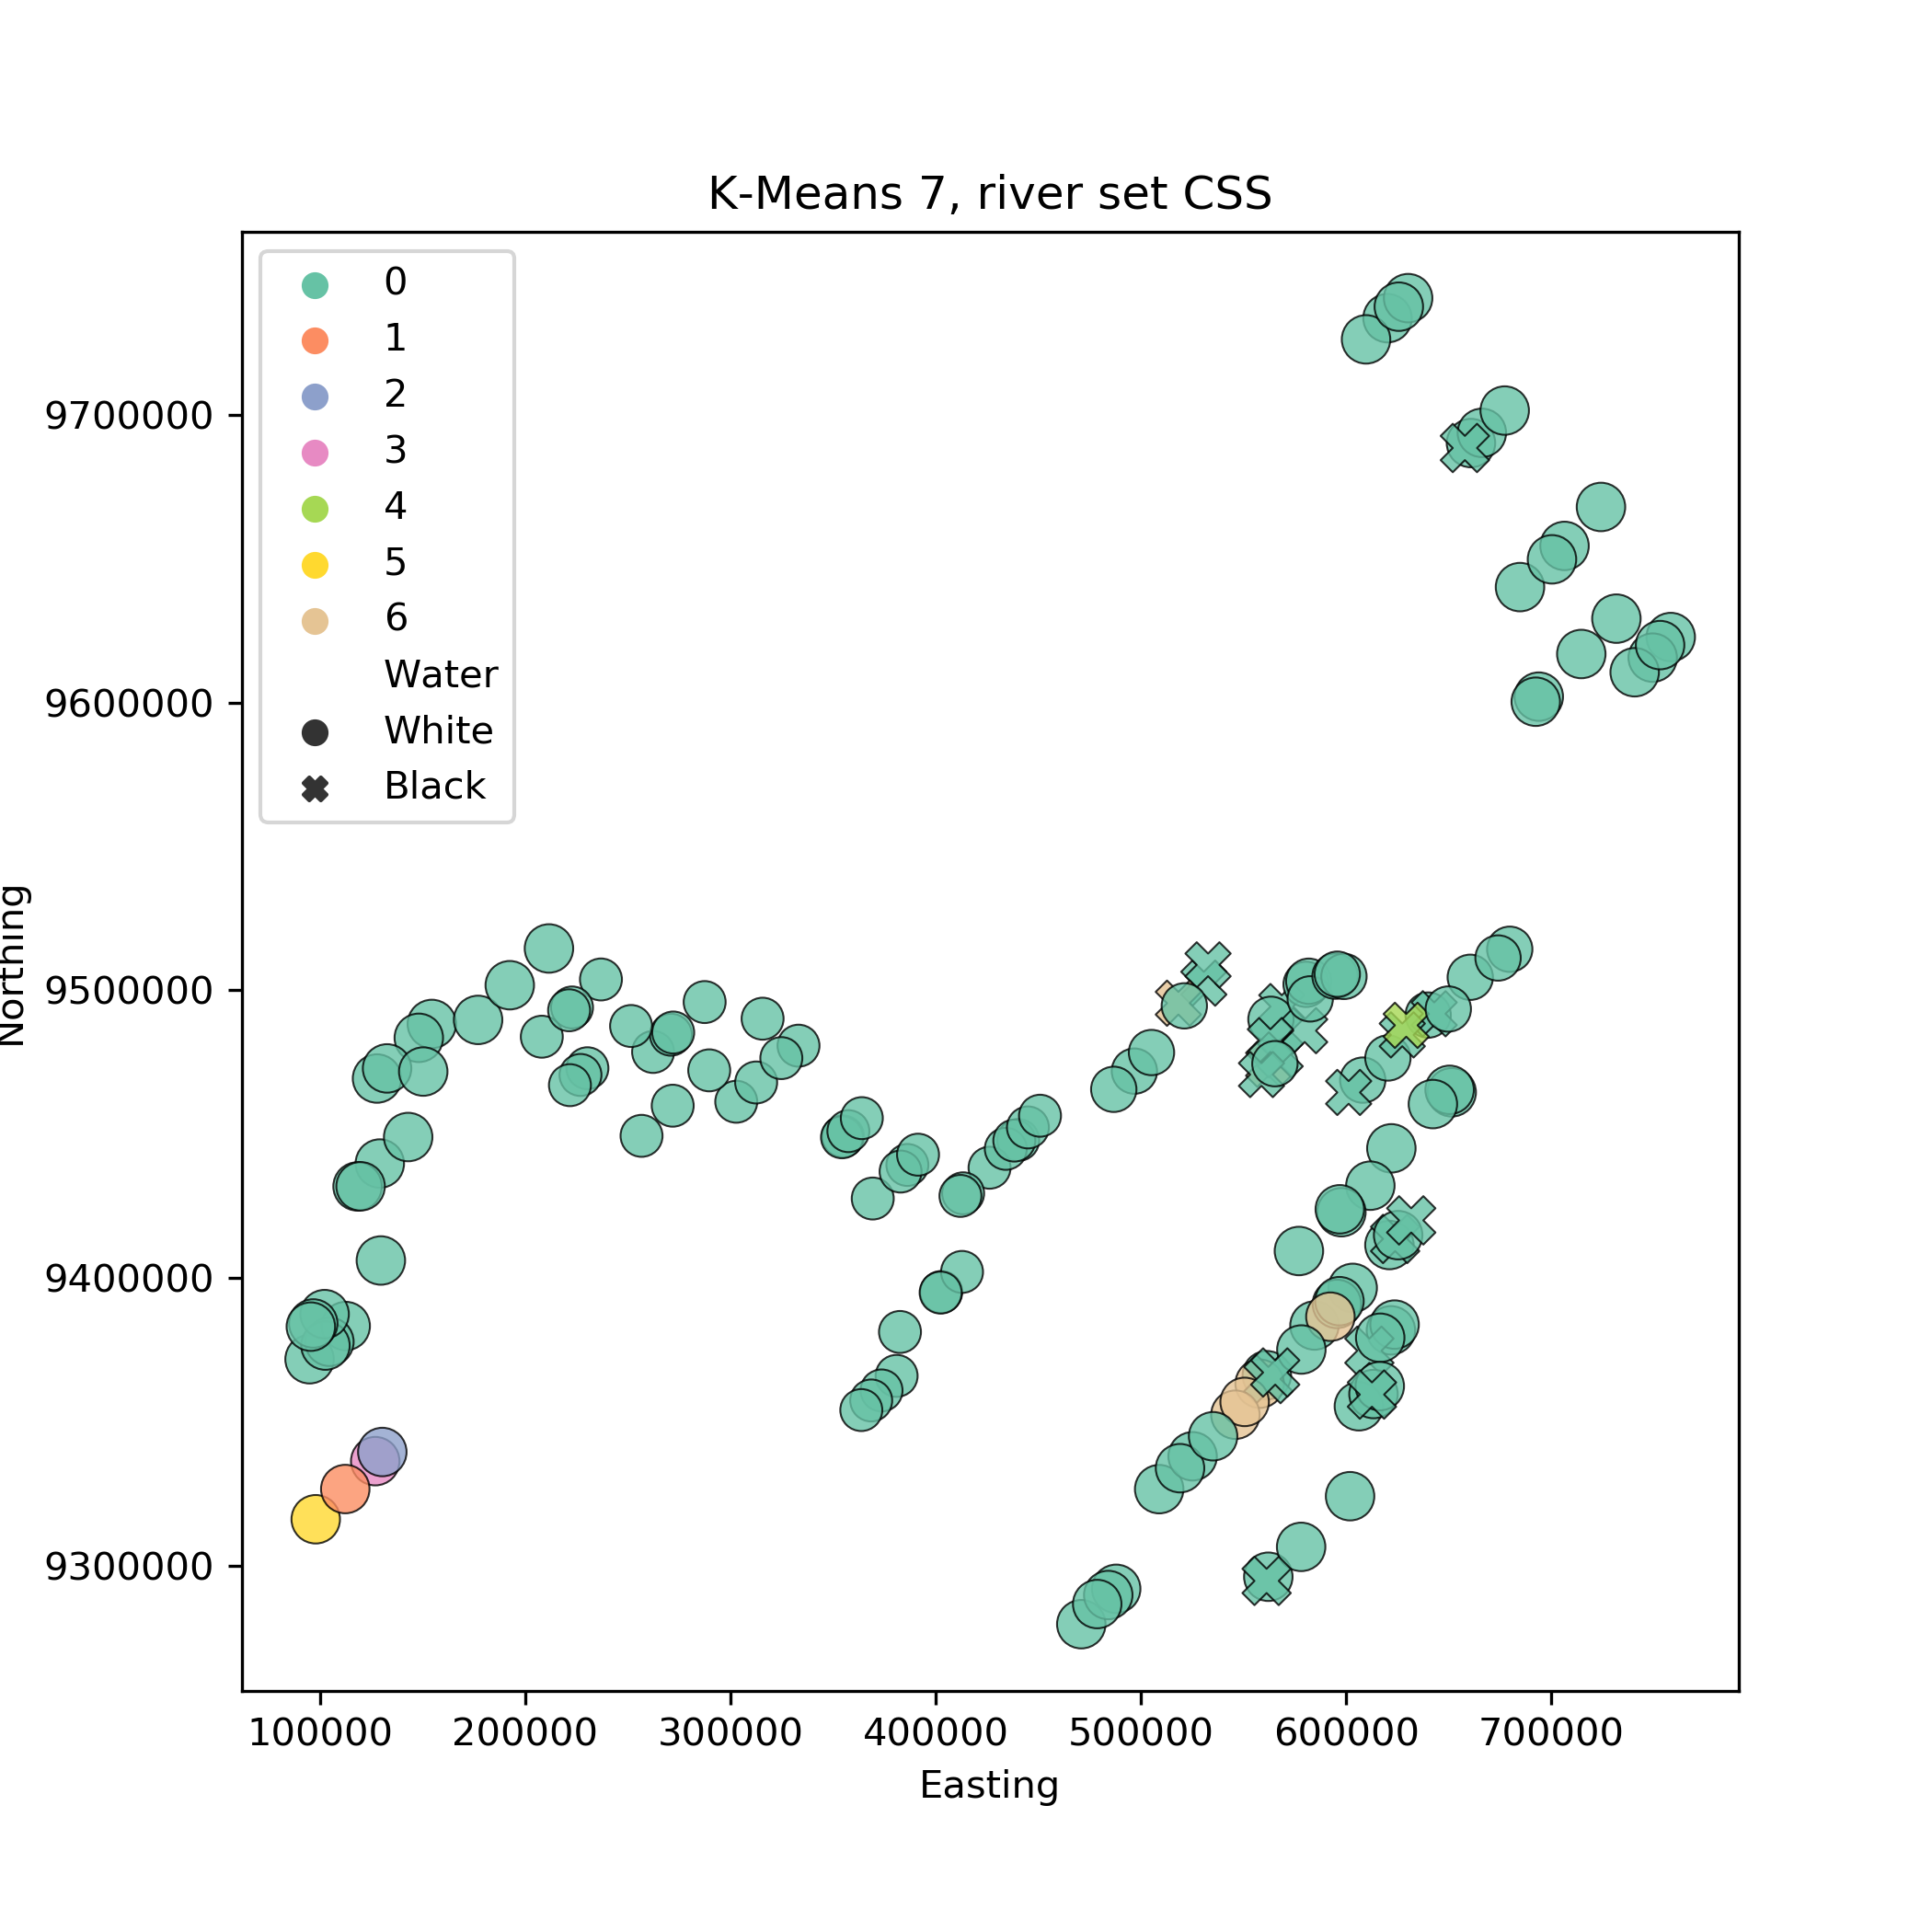
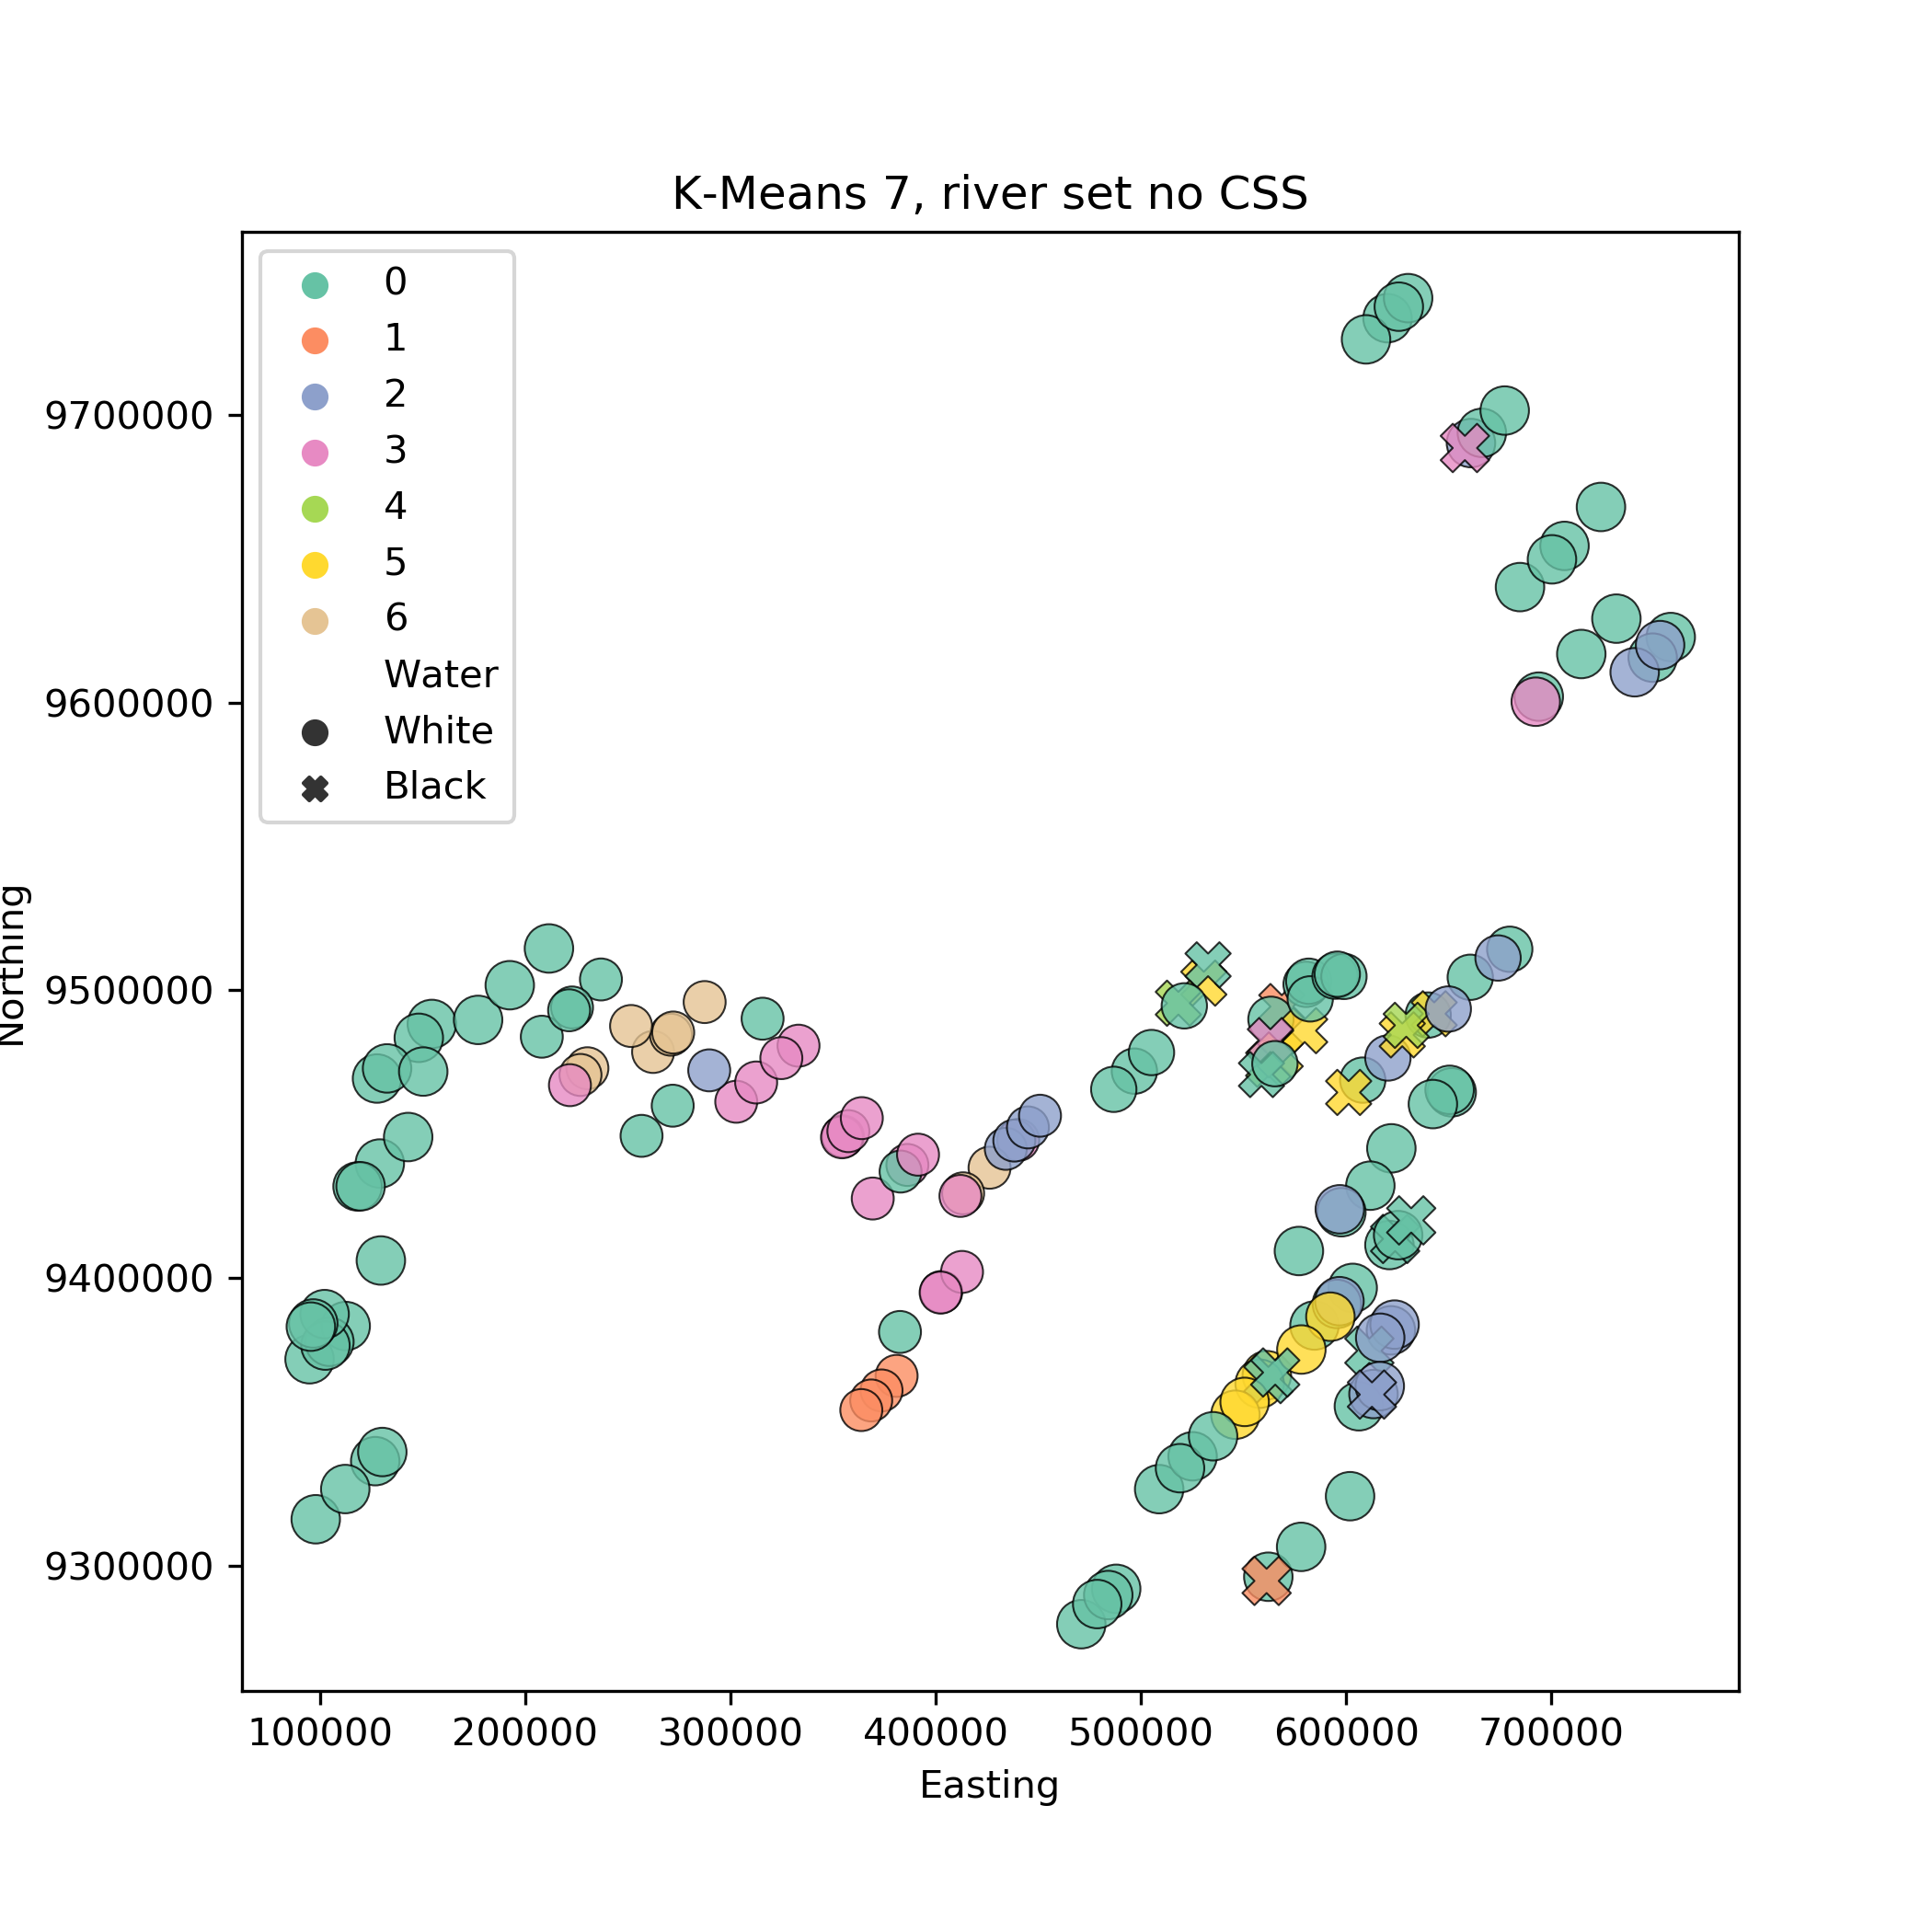
Choosing 7 clusters instead of 2 gives us an interesting separation of parts of the rivers. The algorithm seems to be partitioning the river into geographical parts. Using the full set produces very similar results.
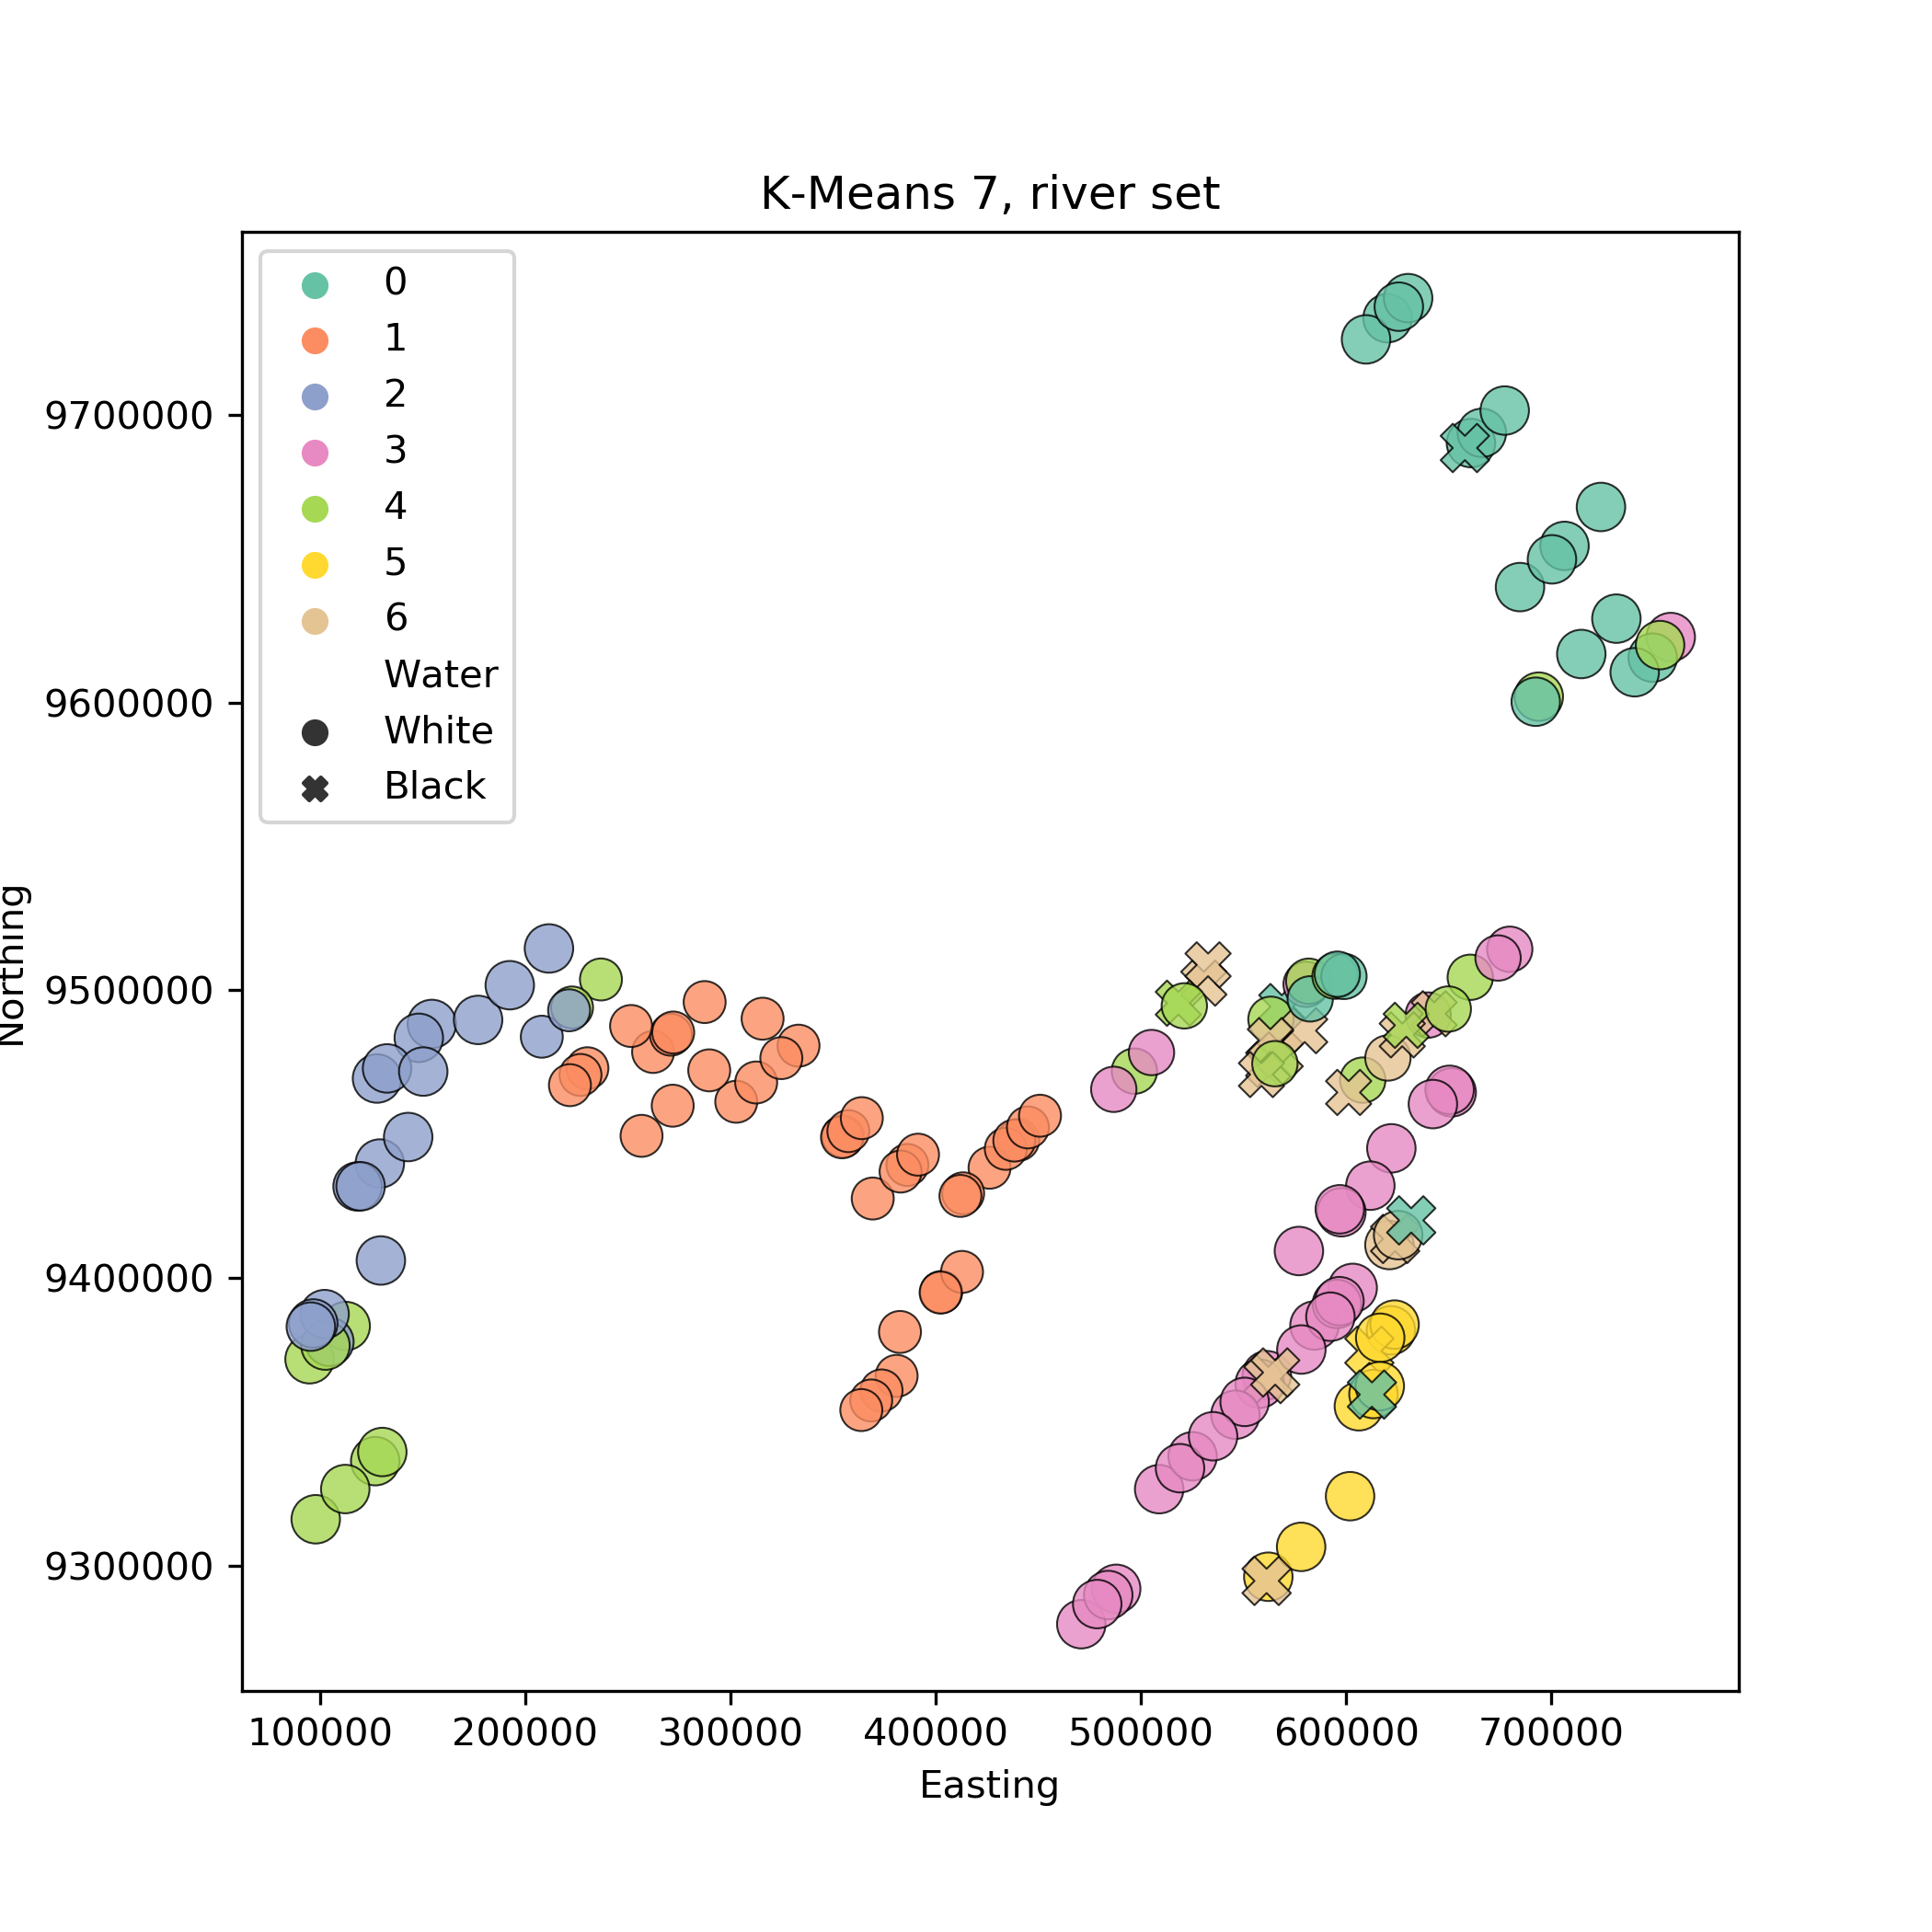
If instead we do not apply either the CSS normalisation or the log transformation the partitionings produced are not very interesting.
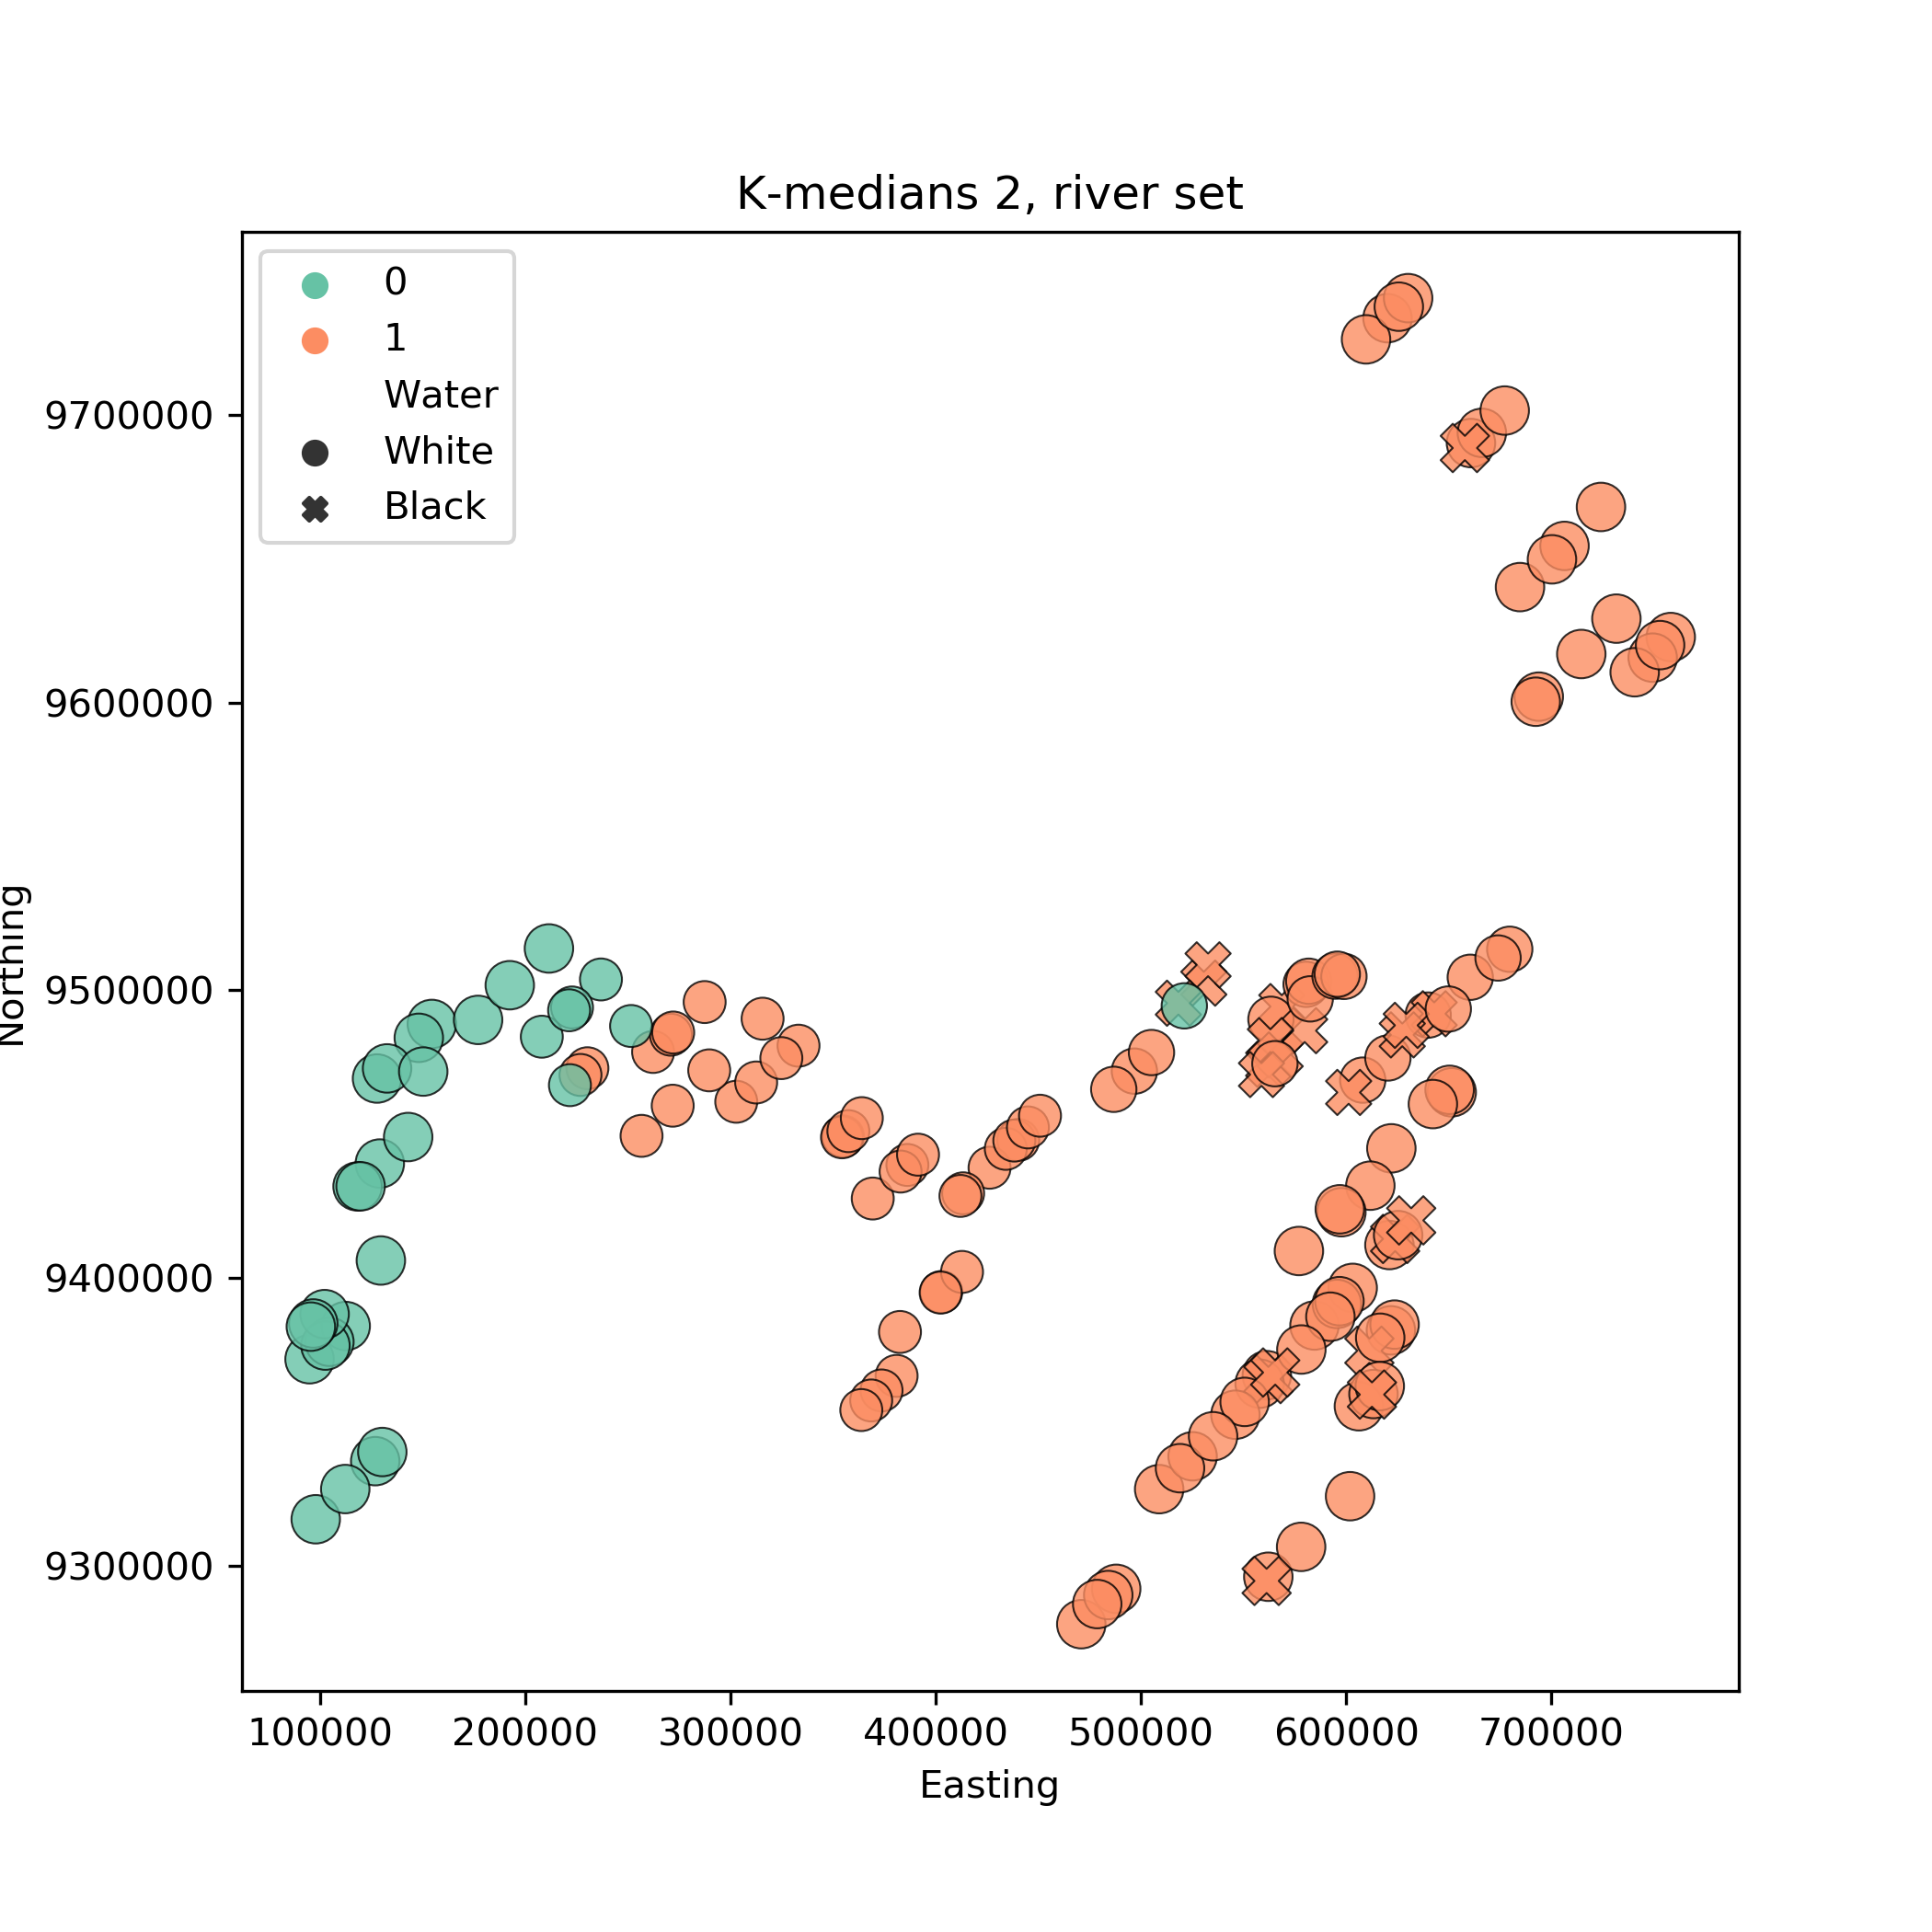
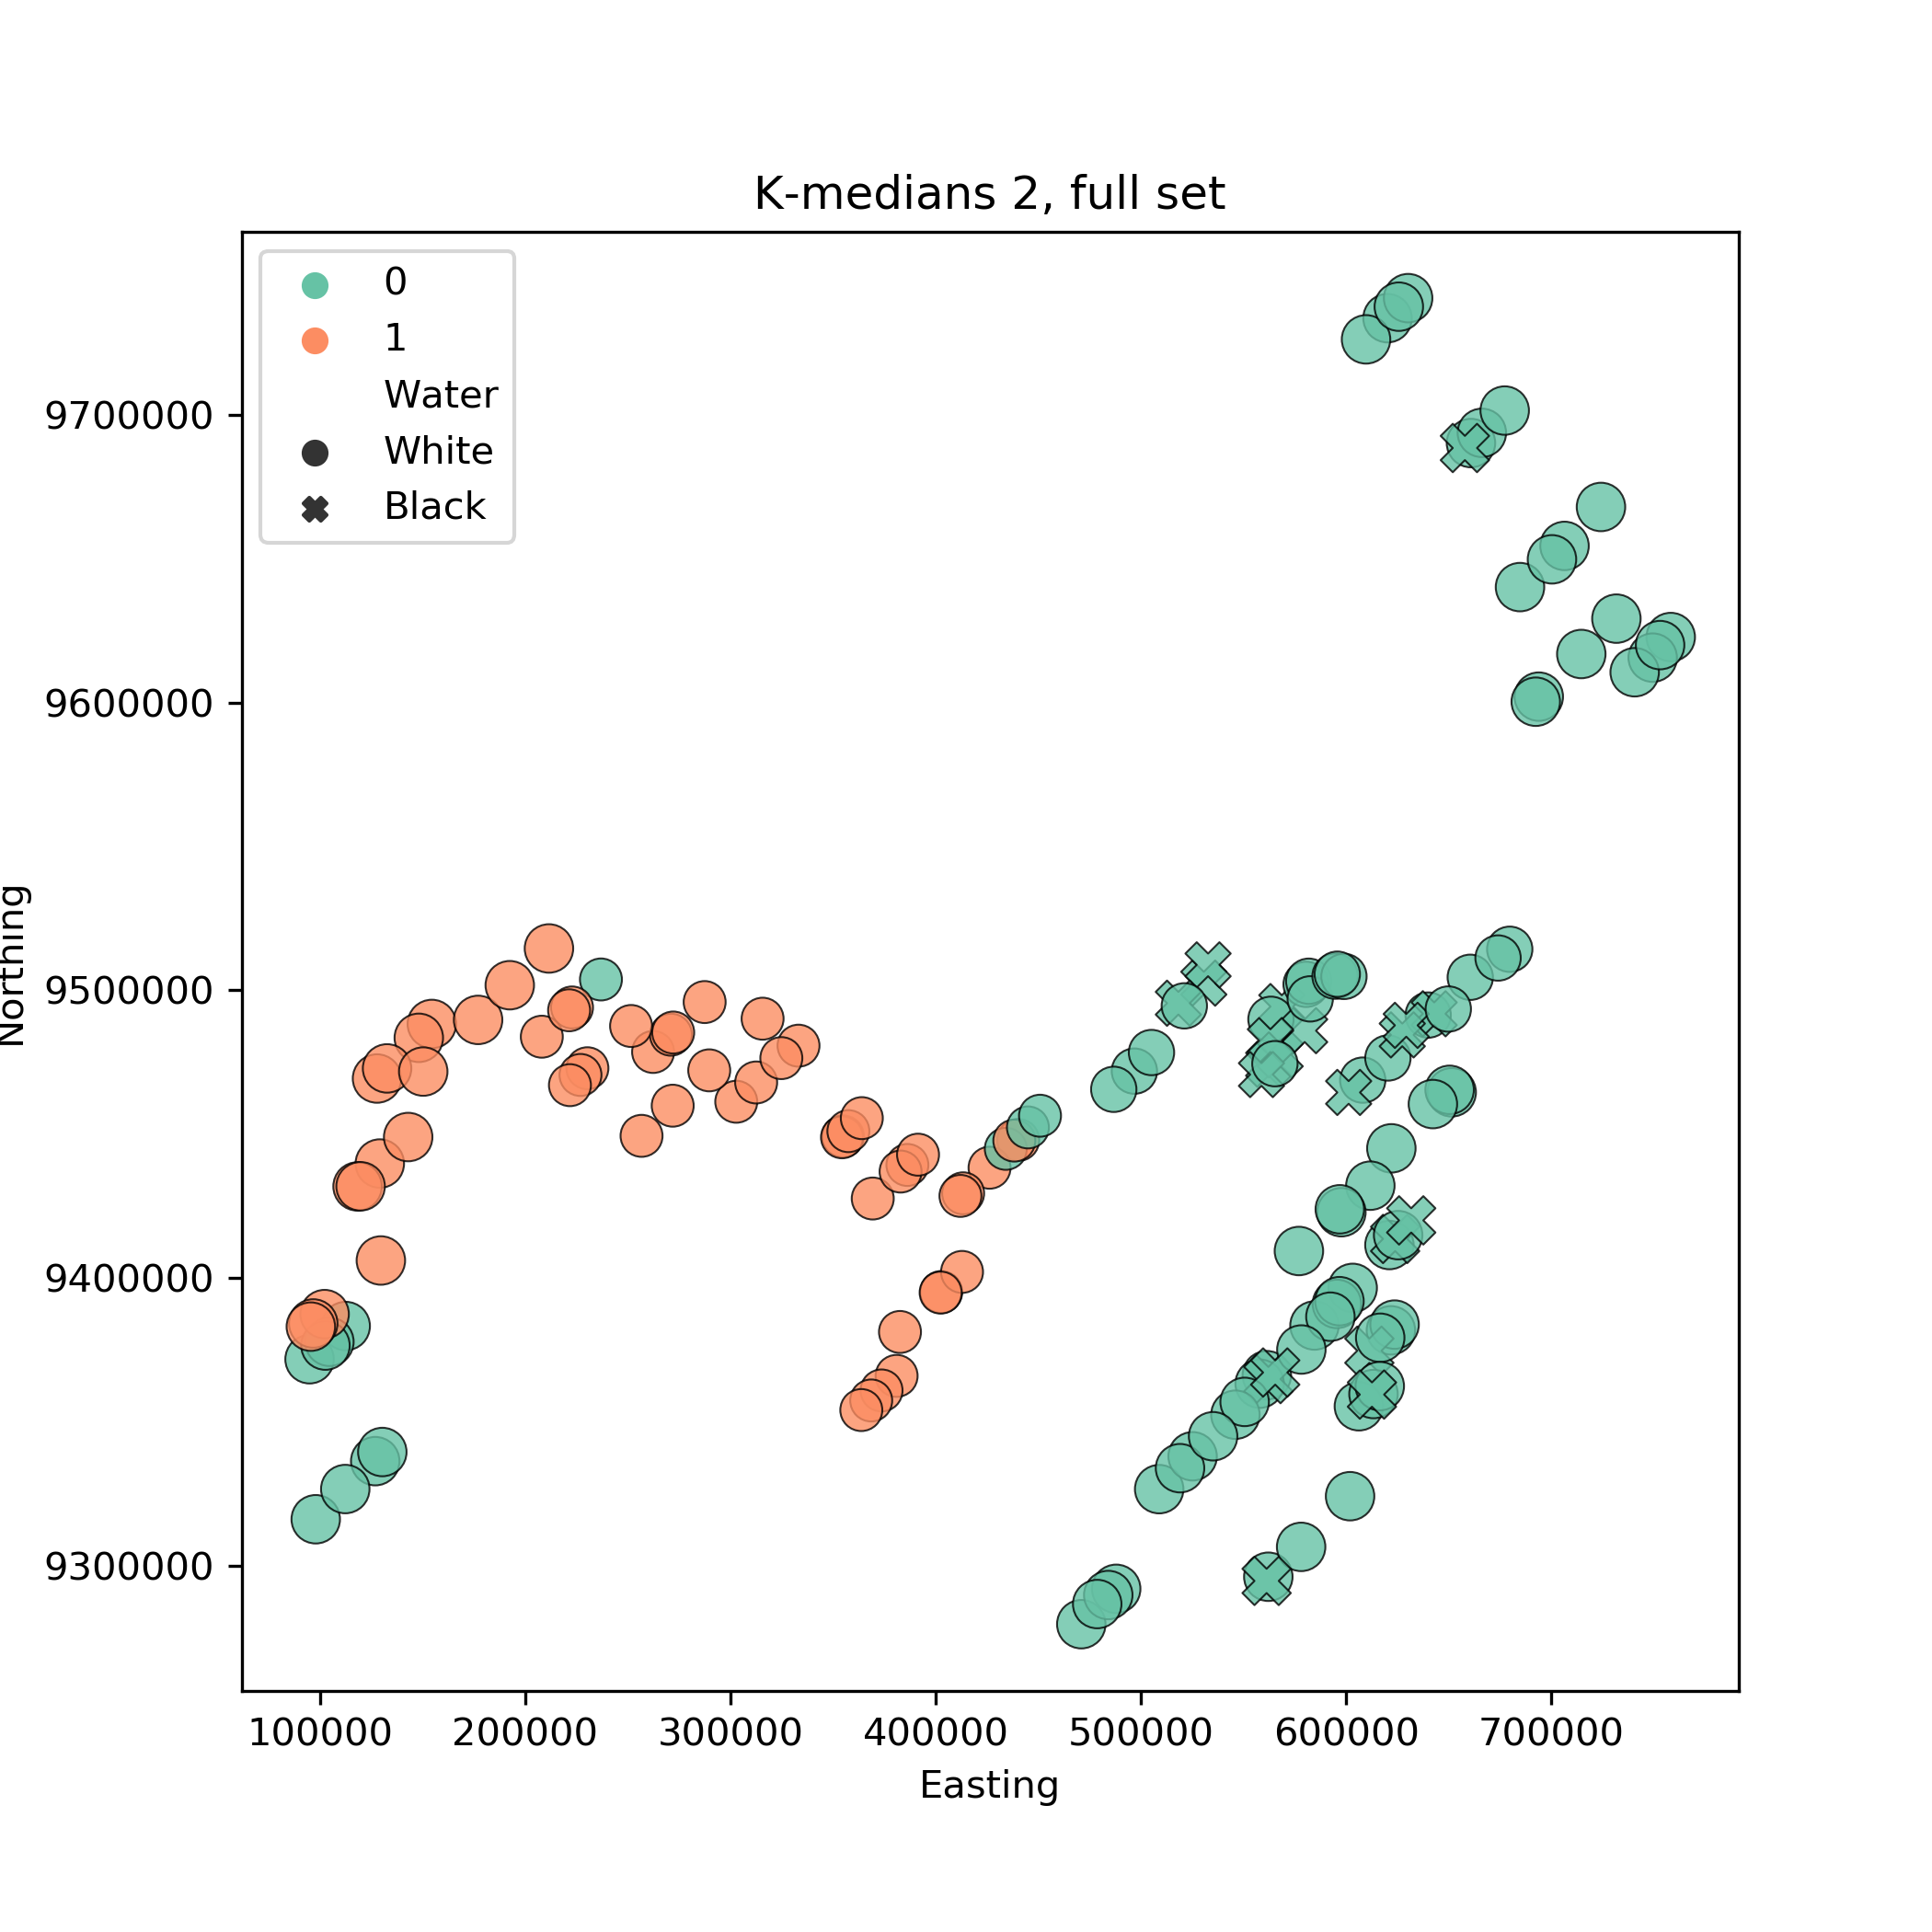
Using KMedians, a variant of KMeans that forms clusters by minimising the inter group median distance from the centeroid rather than the mean, produces a partition based on location as well. It separates the Upper maranon from the rest of the parts as well. Using the full set, creates a different grouping; upper maranon samples are in the same partition as those from mid maranon and tapiche.
Setting the number of clusters to 7 groups the samples primarily based on geography. The full data set seems to produce results matching the areas of the river more than the river set. As in the KMeans result, most of upper maranon samples are grouped together, and there is some confusion in the eastern part of the river. Using the adjusted rand score, which evaluates how similar two sets of groupings are, we found that the KMeans result matches the separation of samples into areas of the river more than KMedians.
In addition to the previous algorithms which require setting the number of clusters to be found, we used HDBSCAN source which only requires determining the minimum number of samples in each potential cluster. Furthermore, it is a “true” clustering algorithms in the sense that it does not require that all points belong to the clusters found; if they do not, it categorises them as unclustered. Applying the algorithm to the river set with minimum samples set to 4 creates 7 clusters, however, only 2 of them contain the majority of points, and most of the samples are unclustered (denoted by a black fill).
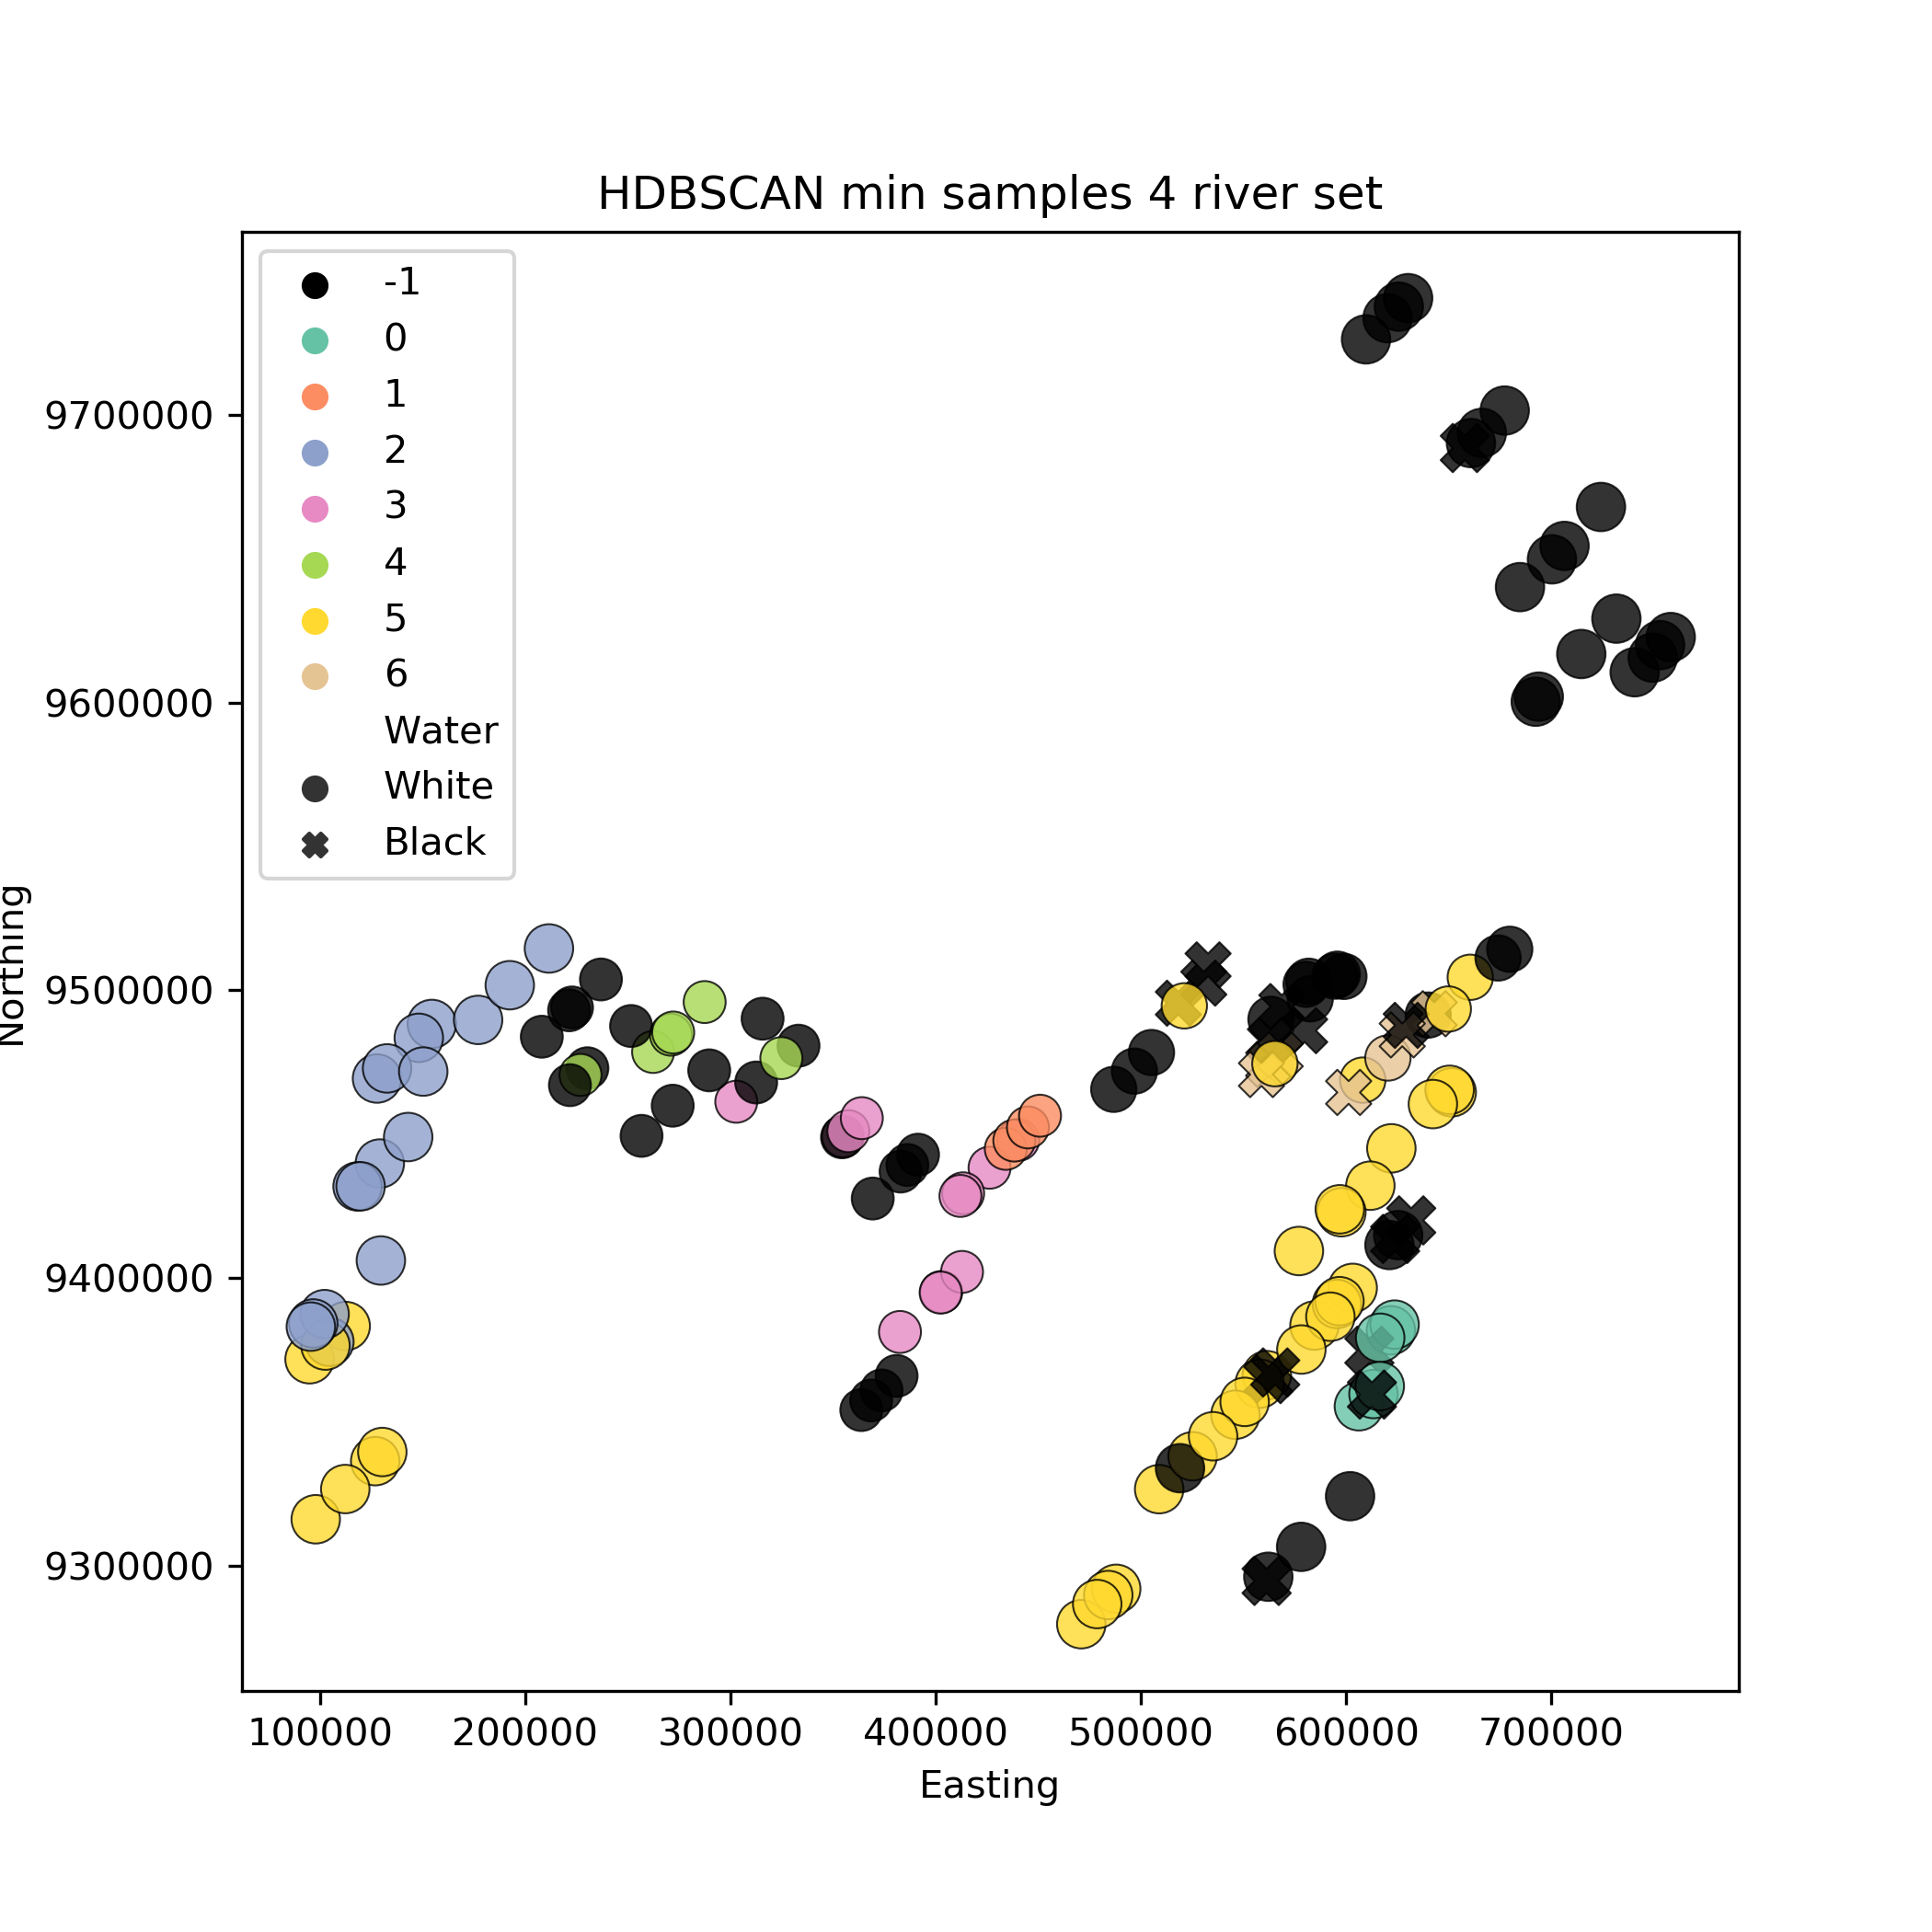
Applying it on the full set with 4 minimum samples creates bigger, and more defined, clusters, and also groups together most of ucayalli samples without the south western upper maranon samples (like in the previous case). Both of them group most of upper maranon samples together, and separate some middle-of-the-river samples as distinct from the others.
The majority of clusterings we performed were mostly influenced, given the meta data we have, by the location of the samples rather than the date of the sampling trip (season) or water colour. Furthermore, almost all of the algorithms used managed to separate, in some way, most of the upper maranon samples from the rest. This finding aligns quite well with the geography of the region; the upper maranon samples are those lying behind the pongo, making the passage hard or impossible for most species.
Supervised Learning
As mentioned earlier, supervised methods require target data to be used for prediction. Suitable variables which were collected for each sample include water colour and the part of the river which they were sourced from. The first set of labels we constructed used just the water colourFrom these we constructed three sets of labels;
These variables act as a proof of concept; if we can predict aspects like location and water colour from OTU counts, then it might be possible to predict a health degradation index given the same type of data.
Notes
unsupervised and supervised ml, what they are -> UML finding patterns in data -> pattern finding example using kmeans ->problem with kmeans and choosing clusters from beforehand so a bit ad hoc, present 6 figures with cluster 2 to 7 (maybe in supplementary)-> present more appropriate exploration algorithm hdbscan-> see if we can predict -> explain how perdictions work, small summary of supervised ->use water, achieve good accuracy with n algorithm show picture. -> What else can we predict-> size of rivers and black water, ok results -> -> new labels and new classification